Technical Analysis of EVGN 2024-05-10
Overview:
In analyzing the technical indicators for EVGN over the last 5 days, we will delve into the trend, momentum, volatility, and volume indicators to provide a comprehensive outlook on the possible stock price movement in the coming days. By examining these key indicators, we aim to offer valuable insights and predictions to guide your investment decisions.
Trend Analysis:
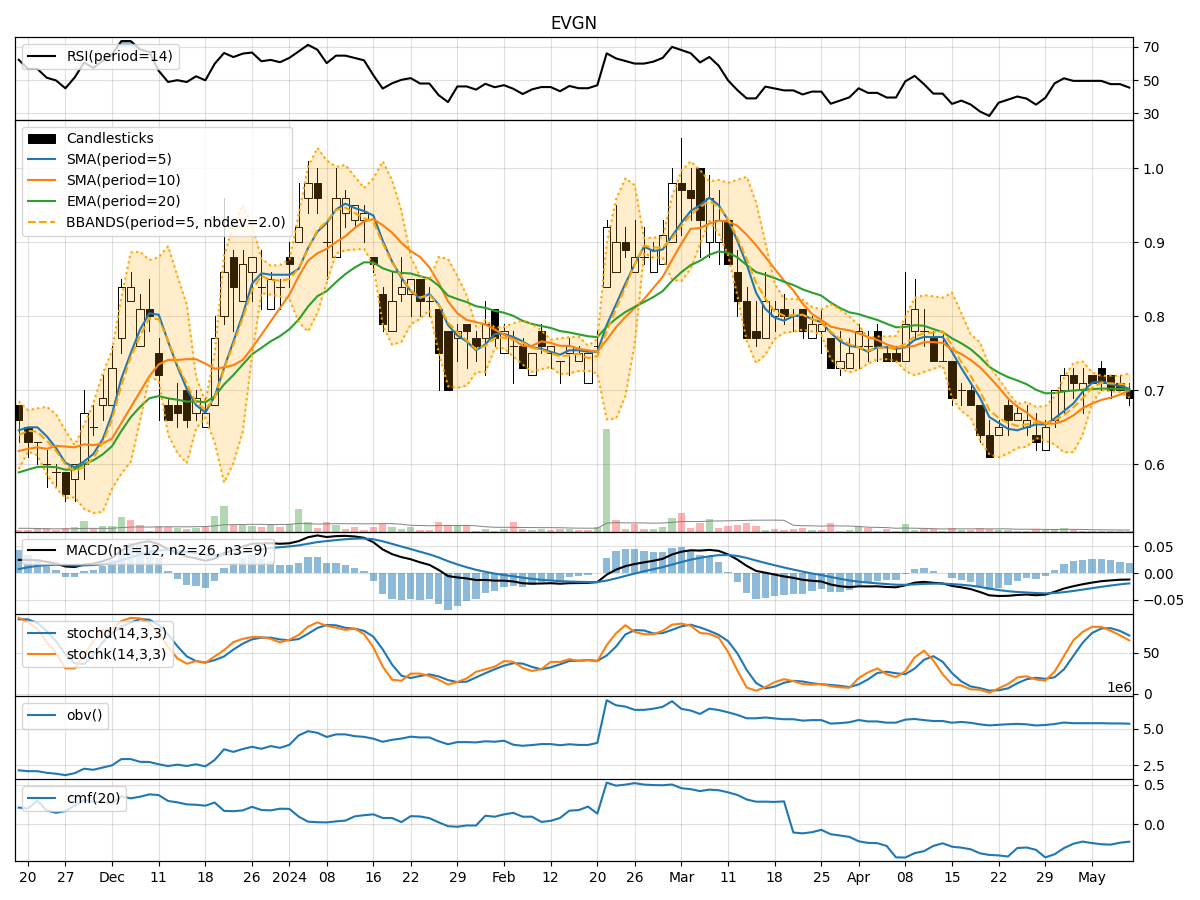
- Moving Averages (MA): The 5-day Moving Average (MA) has been gradually decreasing from 0.710 to 0.702, indicating a short-term downtrend in the stock price.
- MACD and Signal Line: The MACD line has been consistently negative, suggesting a bearish momentum in the stock. The MACD Histogram has also been decreasing, further supporting the bearish sentiment.
Momentum Analysis:
- RSI: The Relative Strength Index (RSI) has been declining, indicating weakening momentum in the stock. The RSI value of around 45 suggests a neutral stance.
- Stochastic Oscillator: Both %K and %D lines of the Stochastic Oscillator have been decreasing, signaling a potential oversold condition in the stock.
Volatility Analysis:
- Bollinger Bands (BB): The Bollinger Bands have been narrowing, indicating decreasing volatility in the stock price. The bands are currently close to each other, suggesting a period of consolidation.
Volume Analysis:
- On-Balance Volume (OBV): The OBV indicator has been decreasing, reflecting a divergence between price and volume, which could indicate a potential trend reversal.
- Chaikin Money Flow (CMF): The CMF has been negative, indicating selling pressure in the stock.
Key Observations:
- The stock is currently in a short-term downtrend based on moving averages.
- Momentum indicators suggest a neutral to slightly bearish sentiment.
- Volatility is decreasing, indicating a period of consolidation.
- Volume indicators show a divergence between price and volume, signaling a potential trend reversal.
Conclusion:
Based on the analysis of the technical indicators, the stock is likely to continue its downward trend in the short term. The momentum is weak, and the volatility is low, indicating a period of consolidation. However, the divergence in volume indicators suggests a potential reversal in the trend. Therefore, it is advisable to exercise caution and closely monitor the stock for any signs of a trend reversal before considering any buying opportunities.