Technical Analysis of EVGR 2024-05-10
Overview:
In analyzing the technical indicators for EVGR over the last 5 days, we will delve into the trend, momentum, volatility, and volume indicators to provide a comprehensive assessment of the stock's potential price movement. By examining these key factors, we aim to offer valuable insights and predictions for the next few days.
Trend Analysis:
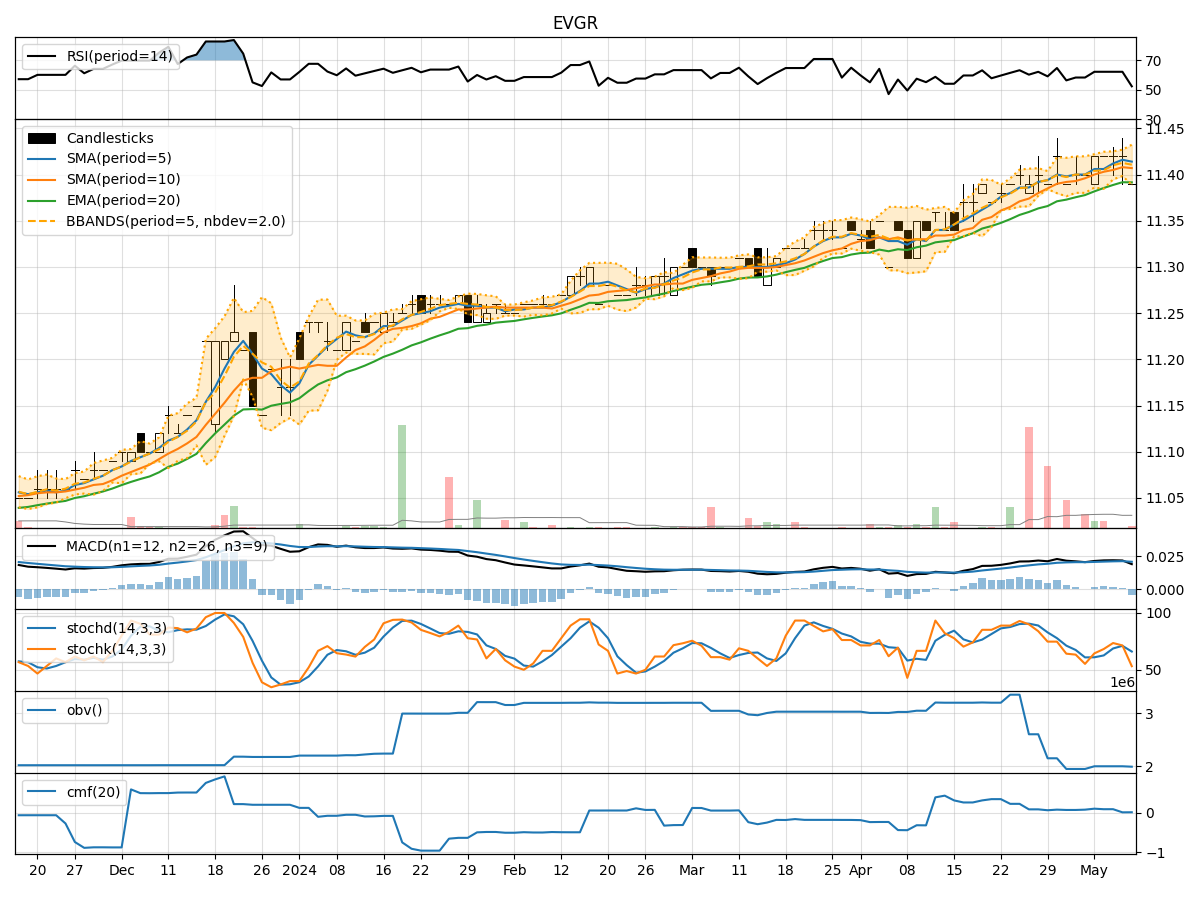
- Moving Averages (MA): The 5-day MA has been relatively stable around the closing price, indicating a neutral trend.
- MACD: The MACD line has shown slight fluctuations but has remained close to the signal line, suggesting a lack of strong momentum in either direction.
- EMA: The EMA has been gradually increasing, reflecting a mild bullish sentiment.
Key Observation: The trend indicators suggest a neutral to slightly bullish outlook for EVGR.
Momentum Analysis:
- RSI: The RSI has been hovering around the mid-range, indicating neither overbought nor oversold conditions.
- Stochastic Oscillator: The stochastic indicators have shown mixed signals, with some fluctuations but no clear trend.
- Williams %R: The Williams %R has been consistently in the oversold territory, signaling a potential reversal.
Key Observation: Momentum indicators are inconclusive, reflecting a lack of strong directional bias.
Volatility Analysis:
- Bollinger Bands: The Bollinger Bands have shown narrowing volatility, with the price approaching the lower band, suggesting a potential consolidation phase.
- Bollinger %B: The %B indicator has decreased, indicating a potential oversold condition.
Key Observation: Volatility indicators point towards a possible consolidation phase or a period of price stabilization.
Volume Analysis:
- On-Balance Volume (OBV): The OBV has been relatively stable, indicating no significant divergence between price and volume.
- Chaikin Money Flow (CMF): The CMF has shown a slight increase, suggesting some buying pressure.
Key Observation: Volume indicators suggest a balanced market sentiment with a slight inclination towards buying pressure.
Conclusion:
Based on the analysis of trend, momentum, volatility, and volume indicators, the next few days for EVGR are likely to see sideways movement with a slight bullish bias. The stock may enter a consolidation phase as indicated by narrowing volatility and stable volume. Traders should exercise caution and wait for clearer signals before making significant trading decisions.