Technical Analysis of EXEL 2024-05-10
Overview:
In analyzing the technical indicators for EXEL over the last 5 days, we will delve into the trend, momentum, volatility, and volume indicators to provide a comprehensive outlook on the possible stock price movement in the coming days. By examining these key aspects, we aim to offer valuable insights and recommendations for potential investors.
Trend Analysis:
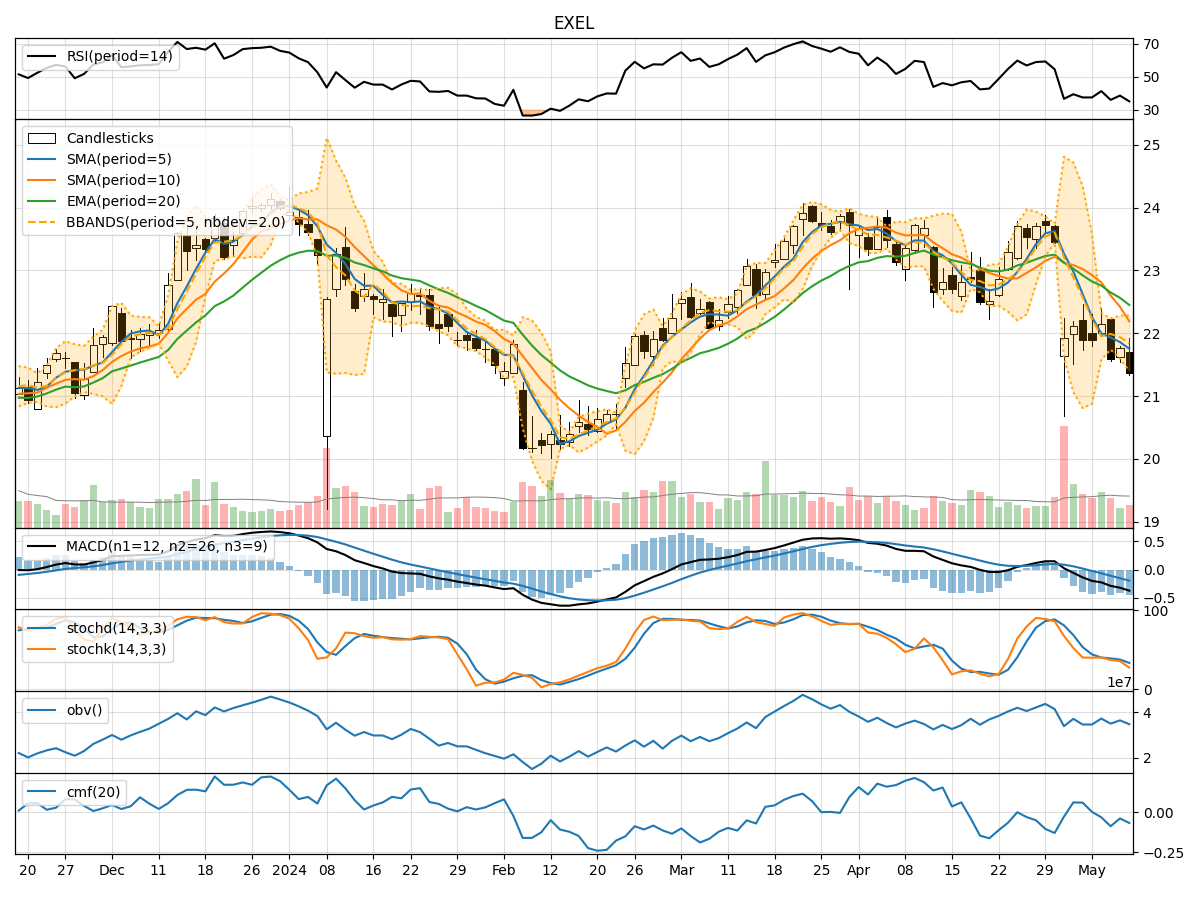
- Moving Averages (MA): The 5-day Moving Average (MA) has been consistently below the Simple Moving Average (SMA) and Exponential Moving Average (EMA) over the past 5 days, indicating a downward trend.
- MACD: The Moving Average Convergence Divergence (MACD) has been negative, with the MACD line consistently below the Signal line, suggesting bearish momentum in the stock.
Momentum Analysis:
- RSI: The Relative Strength Index (RSI) has been hovering around the 30-70 range, indicating a neutral momentum in the stock.
- Stochastic Oscillator: Both %K and %D of the Stochastic Oscillator have been declining, signaling a potential bearish momentum in the stock.
Volatility Analysis:
- Bollinger Bands (BB): The stock price has been trading within the Bollinger Bands, with the bands narrowing, suggesting decreasing volatility in the stock.
- Bollinger %B (BBP): The %B indicator has been relatively low, indicating that the stock price is closer to the lower band, potentially signaling an oversold condition.
Volume Analysis:
- On-Balance Volume (OBV): The OBV has been fluctuating but has not shown a clear trend, indicating mixed sentiment among investors.
- Chaikin Money Flow (CMF): The CMF has been negative, suggesting that money may be flowing out of the stock.
Key Observations:
- The trend indicators point towards a bearish sentiment, with moving averages and MACD signaling a downward trend.
- Momentum indicators show a neutral to bearish momentum, with RSI and Stochastic Oscillator indicating potential weakness.
- Volatility indicators suggest decreasing volatility, potentially leading to a period of consolidation.
- Volume indicators reflect mixed sentiment, with OBV fluctuating and CMF indicating outflow of money.
Conclusion:
Based on the analysis of the technical indicators, the outlook for EXEL in the next few days is bearish. The stock is likely to experience further downward movement, potentially entering a consolidation phase with decreased volatility. Investors should exercise caution and consider waiting for more positive signals before considering any bullish positions.