Technical Analysis of FIVE 2024-05-10
Overview:
In analyzing the provided Technical Analysis (TA) data for the last 5 days, we will delve into the trend, momentum, volatility, and volume indicators to forecast the possible stock price movement for the next few days. By examining these key indicators, we aim to provide a comprehensive and insightful prediction backed by data-driven analysis.
Trend Analysis:
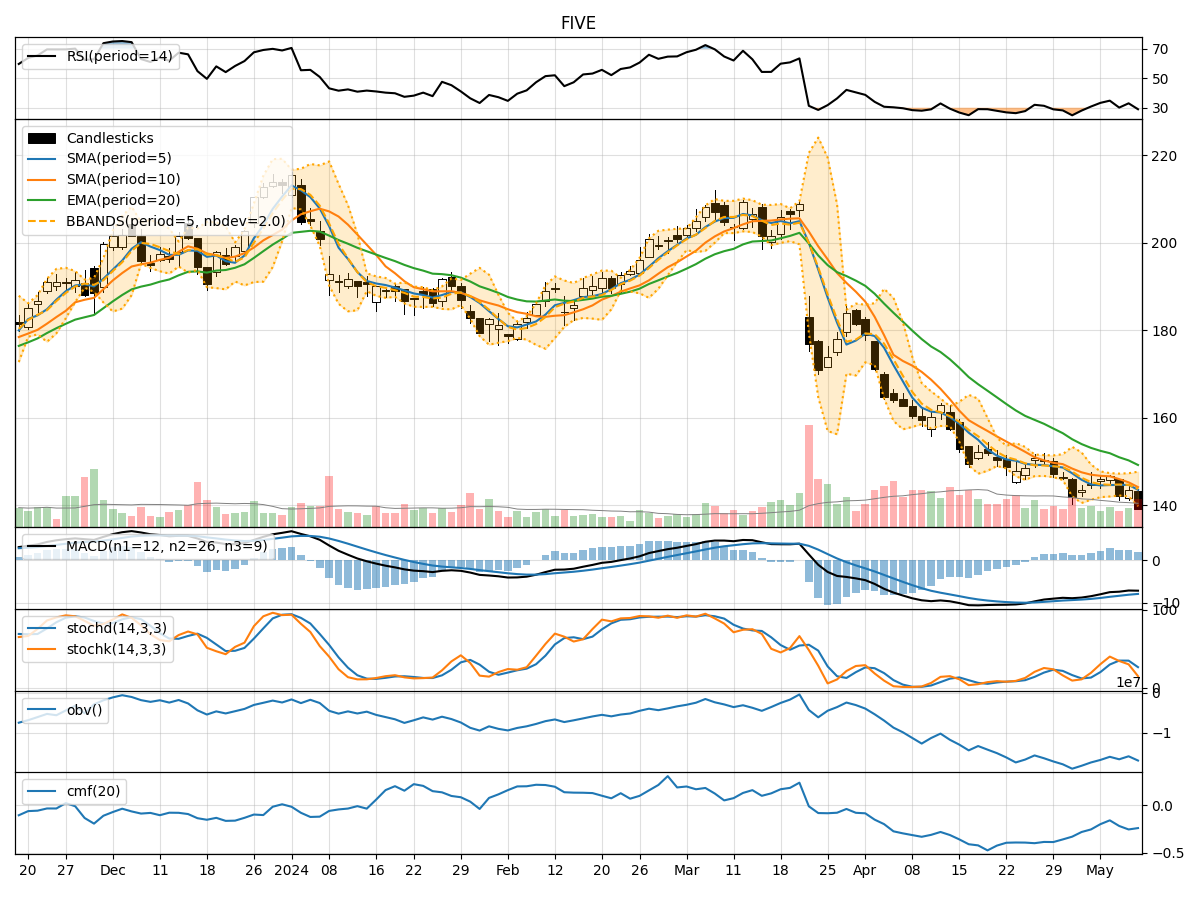
- Moving Averages (MA): The 5-day Moving Average (MA) has been consistently below the Simple Moving Average (SMA) and Exponential Moving Average (EMA) over the past 5 days, indicating a downward trend.
- MACD: The Moving Average Convergence Divergence (MACD) has been negative, with the MACD line consistently below the Signal line, suggesting bearish momentum.
Momentum Analysis:
- RSI: The Relative Strength Index (RSI) has been hovering around 30-35, indicating oversold conditions but not yet showing a clear signal for a reversal.
- Stochastic Oscillator: Both %K and %D have been in the oversold territory, reflecting a potential reversal point, but further confirmation is needed.
Volatility Analysis:
- Bollinger Bands (BB): The stock price has been trading below the lower Bollinger Band, indicating oversold conditions and potential for a reversal.
Volume Analysis:
- On-Balance Volume (OBV): The OBV has been consistently negative, suggesting selling pressure and a bearish sentiment in the market.
- Chaikin Money Flow (CMF): The CMF has been negative, indicating outflow of money from the stock.
Key Observations and Opinions:
- Trend: The stock is currently in a downtrend based on moving averages and MACD.
- Momentum: The momentum indicators suggest a potential reversal due to oversold conditions.
- Volatility: The stock is currently oversold according to Bollinger Bands, indicating a possible bounce back.
- Volume: The negative OBV and CMF signal bearish sentiment and selling pressure.
Conclusion:
Based on the analysis of the technical indicators, the stock is currently in a downtrend with oversold conditions. However, there are signs of a potential reversal in momentum and volatility indicators. Considering the overall bearish sentiment in the market, it is likely that the stock may experience some upward movement in the next few days as it approaches key support levels. Traders should closely monitor the price action and look for confirmation signals before considering any long positions.