Technical Analysis of FOXA 2024-05-10
Overview:
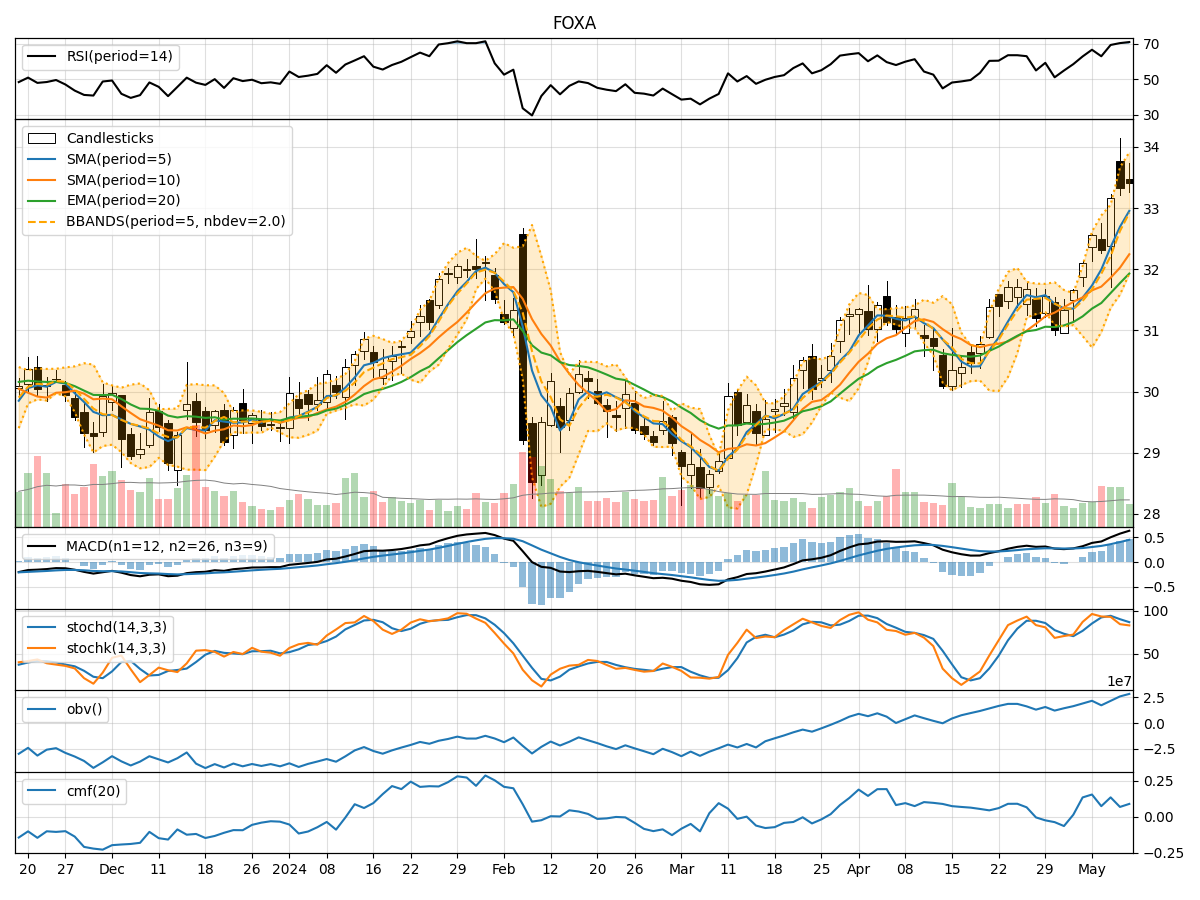
In analyzing the technical indicators for FOXA over the last 5 days, we will delve into the trend, momentum, volatility, and volume indicators to provide a comprehensive outlook on the possible stock price movement in the coming days. By examining these key indicators, we aim to offer valuable insights and predictions for potential investors and traders.
Trend Analysis:
- Moving Averages (MA): The 5-day Moving Average (MA) has been consistently trending above the Simple Moving Average (SMA) and Exponential Moving Average (EMA), indicating a bullish trend.
- MACD: The MACD line has been consistently above the signal line, with both lines showing an upward trend, suggesting bullish momentum.
- RSI: The Relative Strength Index (RSI) has been above 50, indicating bullish momentum in the stock.
Momentum Analysis:
- Stochastic Oscillator: The Stochastic Oscillator has been fluctuating but generally staying in the overbought territory, suggesting a strong bullish momentum.
- Williams %R: The Williams %R has been mostly in the oversold territory, indicating a potential reversal in the bullish momentum.
Volatility Analysis:
- Bollinger Bands: The Bollinger Bands have been widening, indicating increased volatility in the stock price.
- Volatility Bands: The Volatility Bands have shown an upward trend, suggesting potential price movements in the stock.
Volume Analysis:
- On-Balance Volume (OBV): The OBV has shown an overall increase, indicating accumulation by investors.
- Chaikin Money Flow (CMF): The CMF has been positive, suggesting buying pressure in the stock.
Key Observations:
- The trend indicators suggest a strong bullish sentiment in the stock, supported by the moving averages and MACD.
- Momentum indicators show conflicting signals with the Stochastic Oscillator indicating strong bullish momentum, while the Williams %R suggests a potential reversal.
- Volatility indicators point towards increased volatility in the stock price, which could lead to significant price movements.
- Volume indicators indicate accumulation and buying pressure in the stock, supporting the bullish outlook.
Conclusion:
Based on the analysis of the technical indicators, the next few days are likely to see continued upward movement in the stock price of FOXA. The bullish trend supported by moving averages, MACD, RSI, and positive volume indicators outweigh the potential reversal signal from the Williams %R. The increased volatility may lead to sharp price movements, but the overall sentiment remains bullish. Traders and investors could consider taking long positions or holding onto existing positions to benefit from the expected upward movement in the stock price.