Technical Analysis of FRAF 2024-05-31
Overview:
In analyzing the technical indicators for FRAF over the last 5 days, we will delve into the trend, momentum, volatility, and volume indicators to provide a comprehensive outlook on the possible stock price movement in the coming days. By examining these key indicators, we aim to offer valuable insights and predictions for informed decision-making.
Trend Analysis:
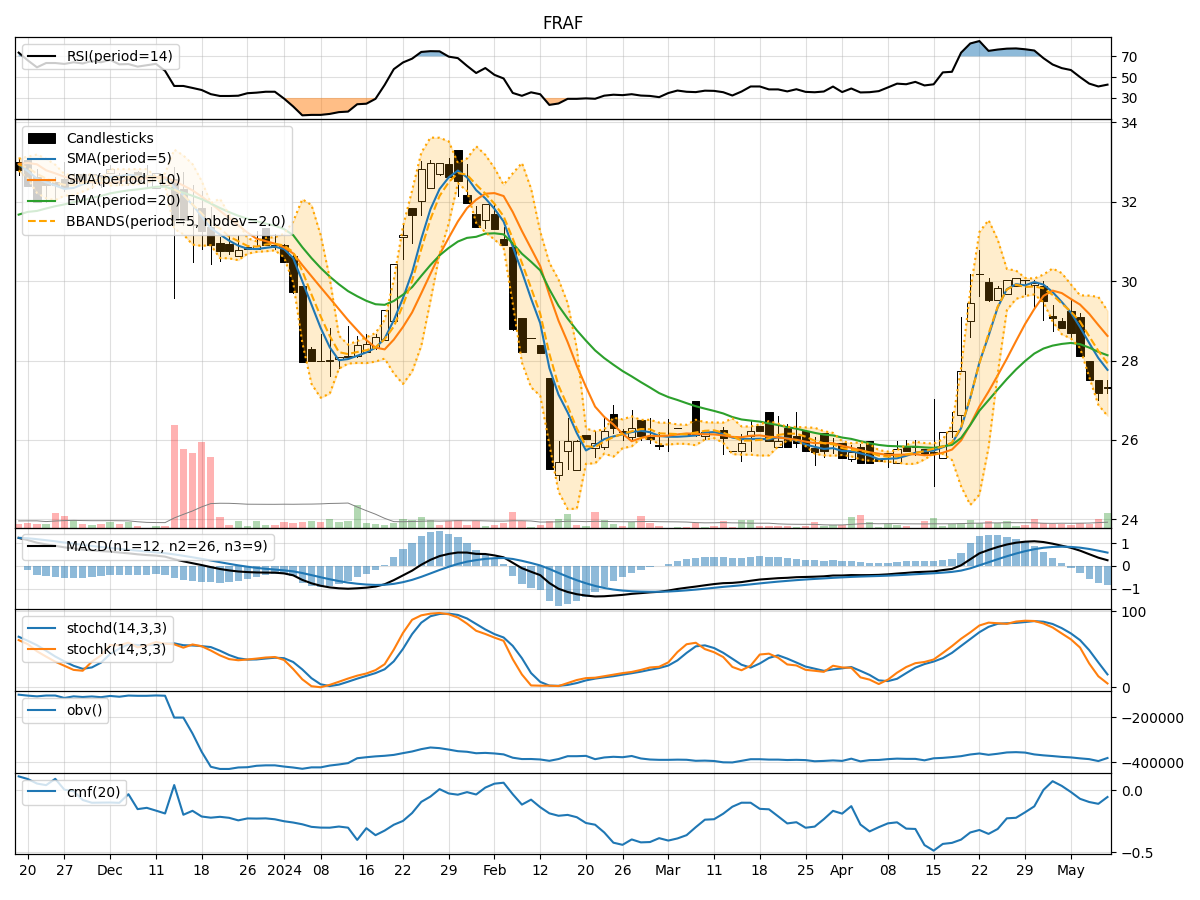
- Moving Averages (MA): The 5-day Moving Average (MA) has been fluctuating around the stock price, indicating a lack of clear trend direction.
- MACD: The Moving Average Convergence Divergence (MACD) has been negative, suggesting a bearish momentum in the short term.
- EMA: The Exponential Moving Average (EMA) has been declining, further supporting the bearish sentiment in the stock.
Momentum Analysis:
- RSI: The Relative Strength Index (RSI) has been below 50, indicating a bearish momentum in the stock.
- Stochastic Oscillator: Both %K and %D have been trending downwards, signaling a bearish momentum.
- Williams %R: The Williams %R has been in the oversold territory, suggesting a potential reversal or continuation of the bearish trend.
Volatility Analysis:
- Bollinger Bands: The Bollinger Bands have been narrowing, indicating decreasing volatility in the stock.
- Bollinger %B: The %B indicator has been hovering around 0.5, suggesting a neutral stance in terms of volatility.
Volume Analysis:
- On-Balance Volume (OBV): The OBV has been negative, indicating selling pressure in the stock.
- Chaikin Money Flow (CMF): The CMF has been consistently negative, reflecting a bearish sentiment among investors.
Key Observations:
- The trend indicators, momentum oscillators, and volume indicators all point towards a bearish outlook for FRAF in the short term.
- The narrowing Bollinger Bands suggest a period of consolidation or decreased volatility in the stock.
- The negative OBV and CMF reinforce the bearish sentiment and selling pressure in the stock.
Conclusion:
Based on the analysis of the technical indicators, it is highly likely that FRAF will experience further downward movement in the coming days. Investors should exercise caution and consider waiting for more favorable conditions before considering any long positions. The overall outlook for FRAF is bearish, and a continuation of the current downtrend is anticipated.