Technical Analysis of FRLA 2024-05-31
Overview:
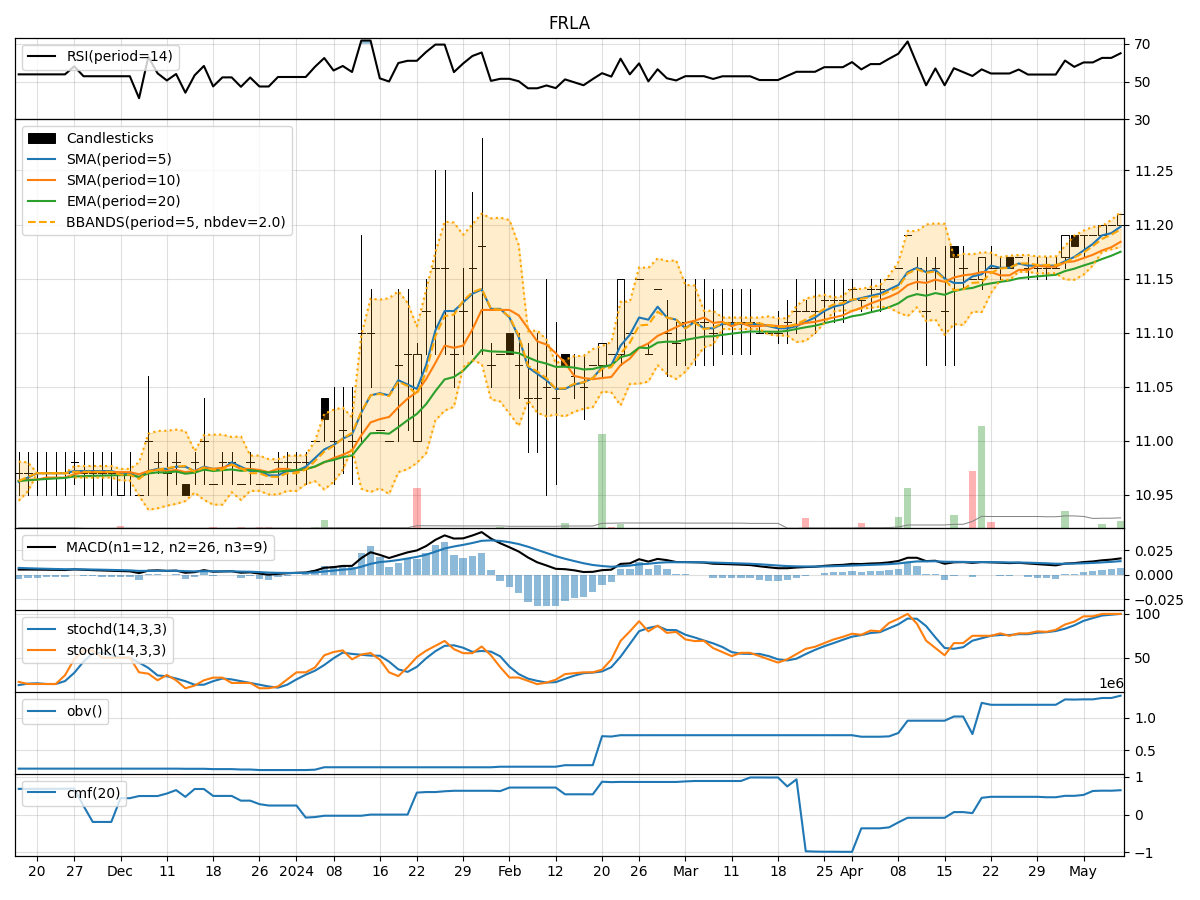
In analyzing the technical indicators for FRLA over the last 5 days, we will delve into the trend, momentum, volatility, and volume indicators to provide a comprehensive outlook on the possible stock price movement. By examining these key factors, we aim to offer valuable insights and predictions for the upcoming days.
Trend Indicators:
- Moving Averages (MA): The 5-day MA has been consistently below the closing price, indicating a short-term downtrend.
- MACD: The MACD line has been decreasing, with the MACD histogram showing negative values, suggesting a bearish momentum.
- EMA: The EMA has been declining, further supporting the bearish trend.
Momentum Indicators:
- RSI: The RSI has been hovering around the neutral zone, indicating a lack of strong momentum in either direction.
- Stochastic Oscillator: Both %K and %D have been low, reflecting a potential oversold condition.
- Williams %R: The indicator has been in the oversold territory, signaling a possible reversal.
Volatility Indicators:
- Bollinger Bands (BB): The bands have been narrowing, suggesting decreasing volatility.
- BB %B: The %B indicator has been fluctuating within a tight range, indicating a lack of significant price movement.
- BB Width: The width of the bands has been contracting, pointing towards a potential period of consolidation.
Volume Indicators:
- On-Balance Volume (OBV): The OBV has been relatively flat, indicating a balance between buying and selling pressure.
- Chaikin Money Flow (CMF): The CMF has been negative, suggesting outflow of money from the stock.
Key Observations and Opinions:
- Trend: The trend indicators suggest a bearish sentiment in the short term.
- Momentum: Momentum indicators show a lack of strong momentum, with potential for a reversal.
- Volatility: Volatility has been decreasing, indicating a period of consolidation.
- Volume: Volume indicators reflect a balanced market sentiment with a slight negative bias.
Conclusion:
Based on the analysis of the technical indicators, the stock of FRLA is likely to experience sideways movement in the upcoming days. The bearish trend, lack of strong momentum, decreasing volatility, and balanced volume suggest a period of consolidation. Traders may expect the stock price to trade within a narrow range without significant directional bias. It is advisable to closely monitor key support and resistance levels for potential breakout opportunities.