Technical Analysis of FSV 2024-05-10
Overview:
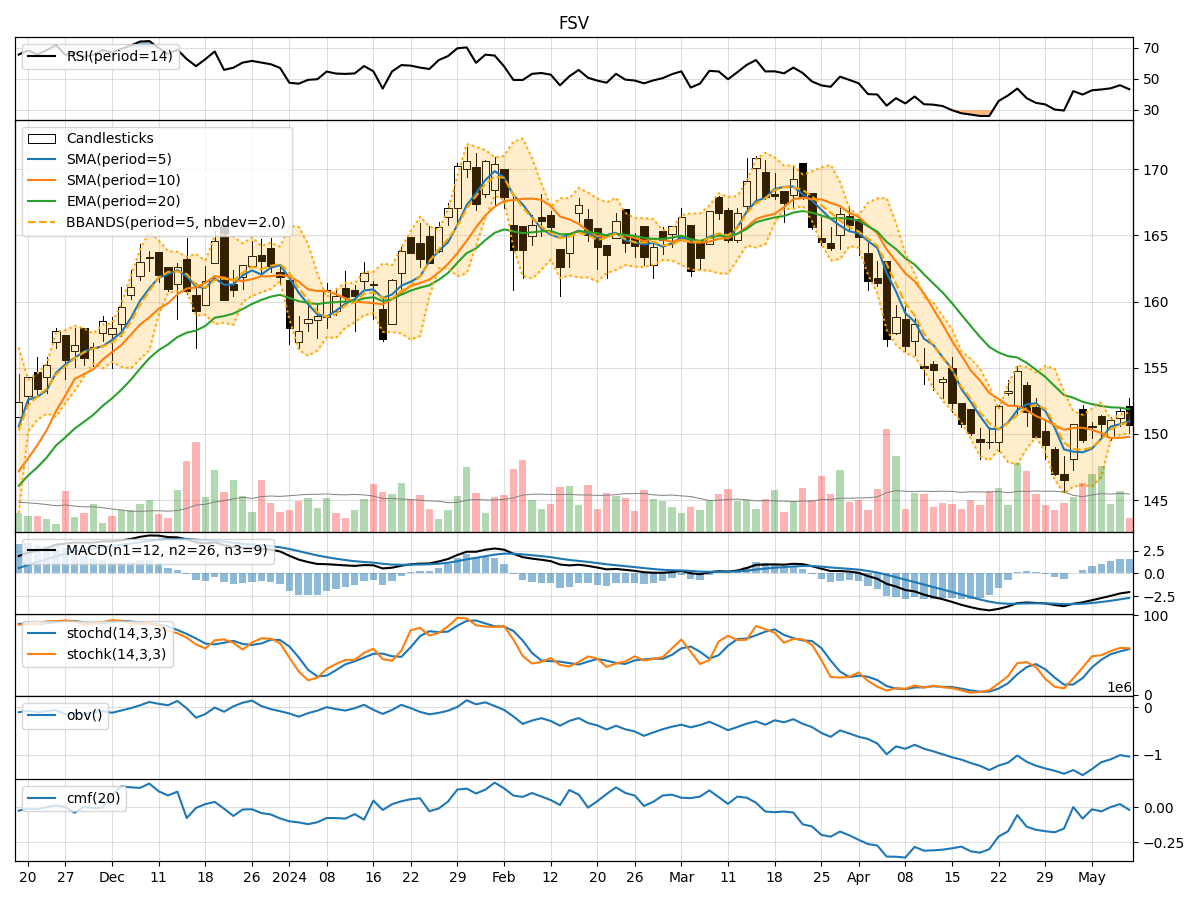
In analyzing the technical indicators for FSV over the last 5 days, we will delve into the trend, momentum, volatility, and volume indicators to provide a comprehensive outlook on the possible stock price movement in the coming days. By examining these key aspects, we aim to offer valuable insights and predictions for informed decision-making.
Trend Analysis:
- Moving Averages (MA): The 5-day MA has been consistently above the closing prices, indicating a short-term uptrend.
- MACD: The MACD line has been negative but showing signs of convergence with the signal line, suggesting a potential reversal.
- EMA: The EMA has been gradually declining, reflecting a weakening trend.
Momentum Analysis:
- RSI: The RSI has been fluctuating around the neutral zone, indicating indecision in the market.
- Stochastic Oscillator: Both %K and %D have been in the overbought territory, signaling a potential reversal.
- Williams %R: The indicator has been in the oversold region, suggesting a possible buying opportunity.
Volatility Analysis:
- Bollinger Bands (BB): The bands have been narrowing, indicating decreasing volatility.
- BB %B: The %B has been hovering around the lower band, suggesting a potential bounce-back.
- BB Width: The width of the bands has been contracting, signaling a period of consolidation.
Volume Analysis:
- On-Balance Volume (OBV): The OBV has been fluctuating, reflecting mixed buying and selling pressure.
- Chaikin Money Flow (CMF): The CMF has been negative, indicating a lack of strong buying interest.
Key Observations:
- The trend indicators suggest a potential reversal in the short term.
- Momentum indicators show conflicting signals, indicating market indecision.
- Volatility is decreasing, signaling a period of consolidation.
- Volume indicators reflect mixed market sentiment with no clear direction.
Conclusion:
Based on the analysis of the technical indicators, the stock price of FSV is likely to experience sideways movement in the next few days. The trend is showing signs of weakness, momentum is indecisive, volatility is decreasing, and volume is mixed. Therefore, it is recommended to exercise caution and closely monitor the price action for any potential breakout or trend reversal before making any trading decisions.