Technical Analysis of FTAI 2024-05-10
Overview:
In analyzing the technical indicators for FTAI over the last 5 days, we will delve into the trend, momentum, volatility, and volume indicators to provide a comprehensive outlook on the possible stock price movement in the coming days. By examining these key indicators, we aim to offer valuable insights and predictions for informed decision-making.
Trend Analysis:
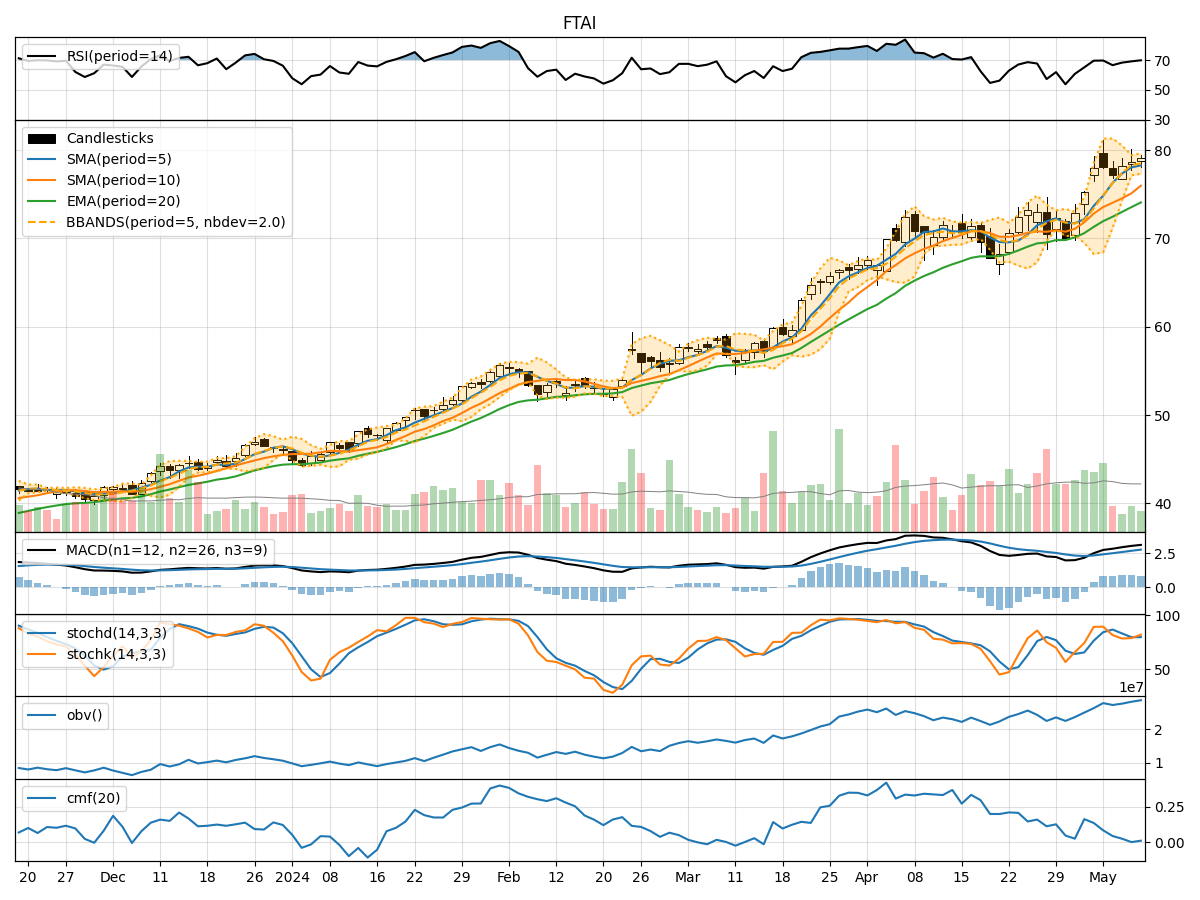
- Moving Averages (MA): The 5-day Moving Average (MA) has been consistently above the Simple Moving Average (SMA) and Exponential Moving Average (EMA), indicating a bullish trend.
- MACD: The MACD line has been above the signal line, with both lines showing an upward trend, suggesting bullish momentum.
- MACD Histogram: The MACD Histogram has been positive and increasing, further supporting the bullish sentiment.
Momentum Analysis:
- RSI: The Relative Strength Index (RSI) has been in the overbought territory but has shown a slight decrease, indicating a potential reversal or consolidation.
- Stochastic Oscillator: Both %K and %D lines of the Stochastic Oscillator have been in the overbought zone, suggesting a possible pullback in the stock price.
- Williams %R: The Williams %R has been in the oversold region, signaling a potential reversal to the upside.
Volatility Analysis:
- Bollinger Bands: The stock price has been trading within the Bollinger Bands, with the bands slightly widening, indicating increased volatility.
- Bollinger %B: The %B indicator has been hovering around 0.8, suggesting the stock is trading near the upper band.
- Bollinger Band Width: The Band Width has been expanding, indicating a potential increase in volatility.
Volume Analysis:
- On-Balance Volume (OBV): The OBV has shown a consistent increase over the last 5 days, indicating strong buying pressure.
- Chaikin Money Flow (CMF): The CMF has been positive but decreasing, suggesting a potential decrease in buying pressure.
Conclusion:
Based on the analysis of the technical indicators, the stock of FTAI is currently in a bullish phase, supported by the positive trend indicators such as the moving averages and MACD. However, the momentum indicators like RSI and Stochastic Oscillator suggest a potential pullback or consolidation in the near term due to overbought conditions.
The volatility indicators point towards increased volatility, which could lead to sharp price movements. The volume analysis indicates strong buying pressure, although the decreasing CMF raises a cautionary flag.
In conclusion, while the overall trend remains bullish, investors should be prepared for a possible short-term correction or consolidation before the stock resumes its upward trajectory. It is advisable to closely monitor key support and resistance levels along with any significant news or market developments that could impact FTAI's stock price movement.