Technical Analysis of FTRE 2024-05-10
Overview:
In analyzing the technical indicators for FTRE over the last 5 days, we will delve into the trend, momentum, volatility, and volume indicators to provide a comprehensive outlook on the possible stock price movement in the coming days. By examining key metrics such as moving averages, MACD, RSI, Bollinger Bands, and OBV, we aim to offer valuable insights and predictions for potential price trends.
Trend Indicators:
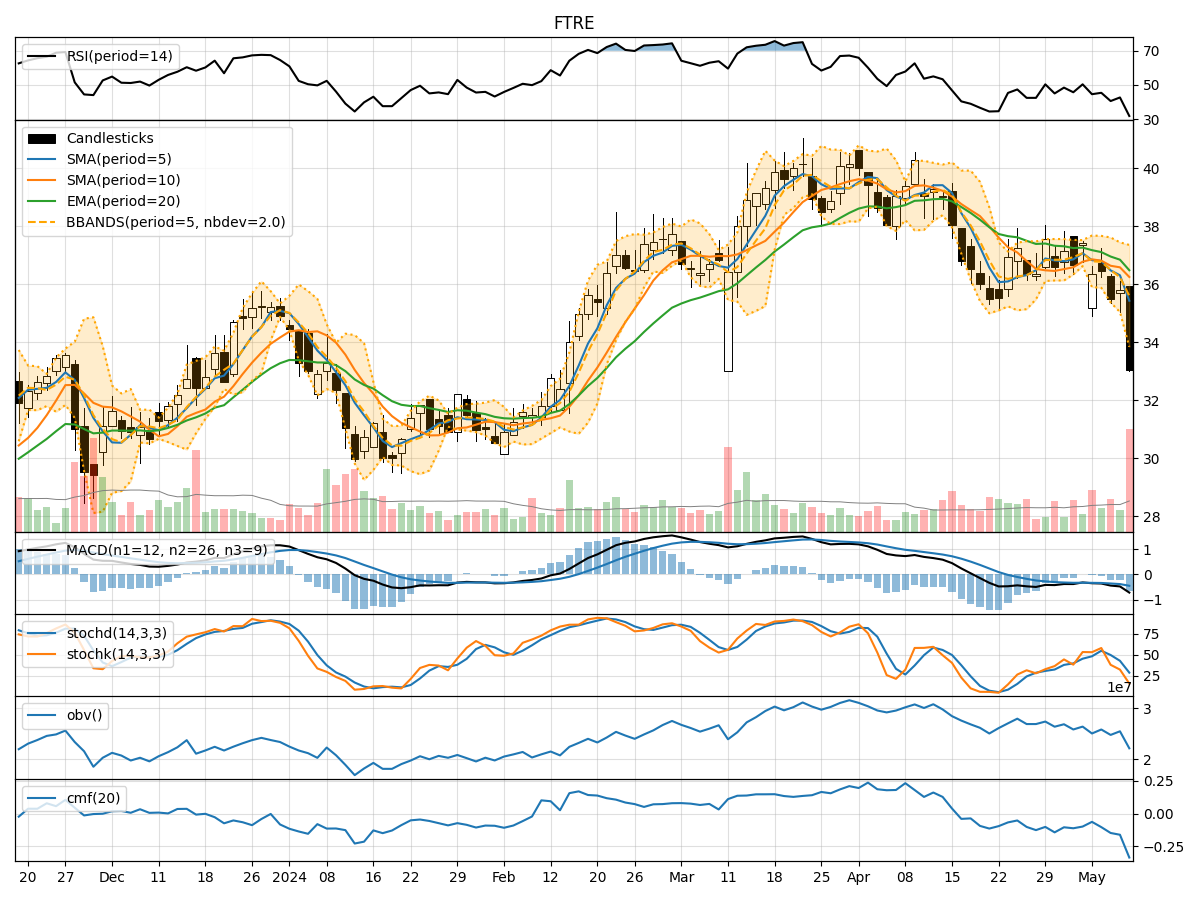
- Moving Averages (MA): The 5-day MA has been consistently below the closing prices, indicating a short-term downtrend.
- MACD: The MACD line has been negative, with the MACD histogram showing a decreasing trend, signaling bearish momentum.
- EMA: The EMA has been trending downwards, reflecting a weakening price trend.
Momentum Indicators:
- RSI: The RSI has been fluctuating around the midline, suggesting indecision in the market.
- Stochastic Oscillator: Both %K and %D have been declining, indicating a loss of bullish momentum.
- Williams %R: The indicator has been in oversold territory, signaling a potential reversal.
Volatility Indicators:
- Bollinger Bands: The stock price has been trading below the lower Bollinger Band, indicating oversold conditions.
- Bollinger %B: The %B indicator is close to 0, suggesting a possible bounce back in price.
- Bollinger Band Width: The band width has widened, indicating increased volatility.
Volume Indicators:
- On-Balance Volume (OBV): The OBV has been declining, suggesting distribution and selling pressure.
- Chaikin Money Flow (CMF): The CMF has been negative, indicating outflows from the stock.
Key Observations and Opinions:
- Trend: The trend indicators point towards a downward trajectory in the stock price.
- Momentum: Momentum indicators suggest a weakening of bullish momentum.
- Volatility: Volatility indicators show an increase in market volatility.
- Volume: Volume indicators indicate selling pressure and distribution.
Conclusion:
Based on the analysis of the technical indicators, the next few days' possible stock price movement for FTRE is likely to be downward. The overall trend, momentum, volatility, and volume signals align towards a bearish outlook. Traders and investors should exercise caution and consider potential shorting opportunities or wait for a clearer signal of a trend reversal before considering long positions.