Technical Analysis of FWONK 2024-05-10
Overview:
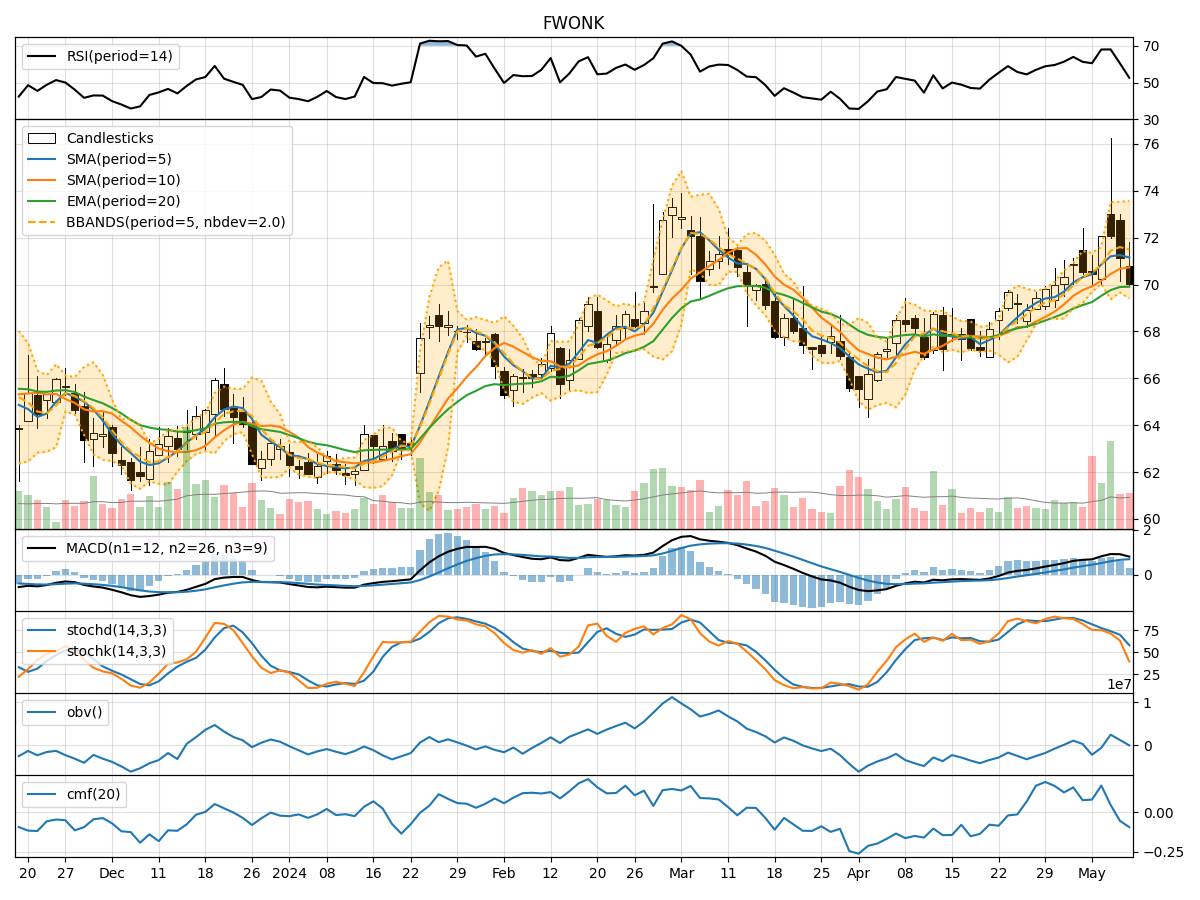
In analyzing the technical indicators for FWONK over the last 5 days, we will delve into the trend, momentum, volatility, and volume indicators to provide a comprehensive outlook on the possible stock price movement in the coming days. By examining these key aspects, we aim to offer valuable insights and predictions for informed decision-making.
Trend Analysis:
- Moving Averages (MA): The 5-day Moving Average (MA) has been relatively stable around the current price levels, indicating a short-term trend.
- MACD: The Moving Average Convergence Divergence (MACD) shows a positive trend with the MACD line consistently above the signal line, suggesting bullish momentum.
Momentum Analysis:
- RSI: The Relative Strength Index (RSI) has been fluctuating but generally staying within the neutral range, indicating a balanced momentum.
- Stochastic Oscillator: The Stochastic Oscillator reflects a recent decline in momentum, moving towards oversold levels.
Volatility Analysis:
- Bollinger Bands (BB): The Bollinger Bands have shown narrowing volatility, suggesting a potential decrease in price fluctuations.
Volume Analysis:
- On-Balance Volume (OBV): The OBV has been mixed, indicating some distribution of shares in recent trading sessions.
- Chaikin Money Flow (CMF): The CMF has been negative, signaling a potential outflow of money from the stock.
Key Observations:
- The trend indicators suggest a positive momentum in the short term.
- Momentum indicators show a slight weakening in buying pressure.
- Volatility has been decreasing, indicating a possible period of consolidation.
- Volume indicators point towards mixed sentiment with some selling pressure.
Conclusion:
Based on the analysis of the technical indicators, the next few days for FWONK could see sideways movement or a slight pullback in the stock price. The positive trend indicators may support the stock at current levels, but the weakening momentum and mixed volume signals suggest a potential for consolidation or minor correction. Traders should closely monitor key support and resistance levels for potential entry or exit points.
Recommendation:
- Short-term Traders: Consider taking profits or tightening stop-loss levels to manage risk.
- Long-term Investors: Monitor the price action for potential buying opportunities at lower levels.
By combining insights from trend, momentum, volatility, and volume indicators, investors can make well-informed decisions aligned with the current market dynamics. Remember to adapt your strategy based on real-time market developments and risk tolerance levels.