Technical Analysis of FYBR 2024-05-10
Overview:
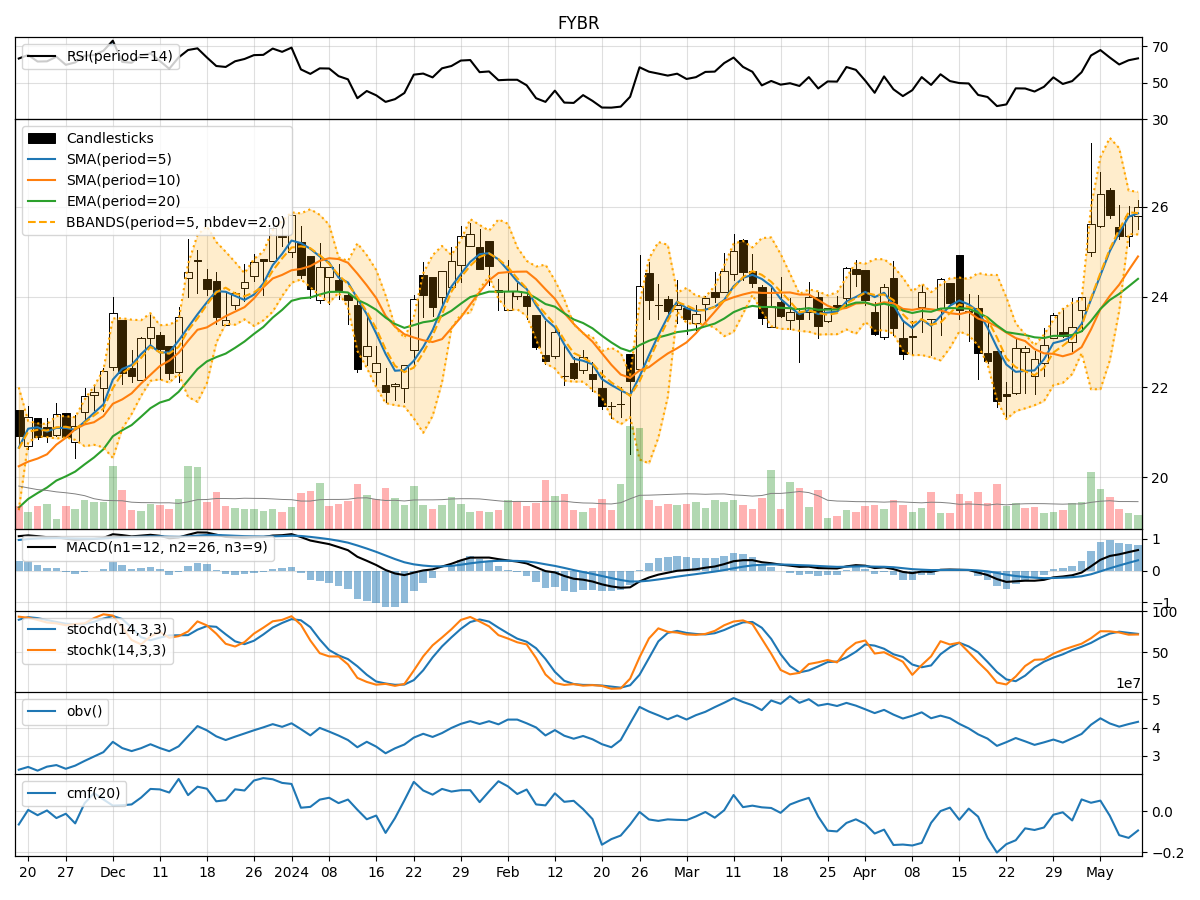
In analyzing the technical indicators for FYBR over the last 5 days, we will delve into the trend, momentum, volatility, and volume indicators to provide a comprehensive outlook on the possible stock price movement in the coming days.
Trend Indicators:
- Moving Averages (MA): The 5-day MA has been consistently above the closing price, indicating a bullish trend.
- MACD: The MACD line has been above the signal line, suggesting a bullish momentum.
- EMA: The EMA has been trending upwards, supporting the bullish sentiment.
Momentum Indicators:
- RSI: The RSI has been fluctuating around the 60-70 range, indicating a neutral to slightly bullish momentum.
- Stochastic Oscillator: Both %K and %D have been in the overbought zone, suggesting a potential reversal or consolidation.
- Williams %R: The indicator has been hovering around the oversold territory, signaling a potential buying opportunity.
Volatility Indicators:
- Bollinger Bands: The price has been trading within the bands, indicating a period of consolidation.
- Bollinger %B: The %B indicator has been fluctuating around the midline, suggesting a lack of clear direction.
- Average True Range (ATR): The ATR has been relatively stable, indicating consistent volatility levels.
Volume Indicators:
- On-Balance Volume (OBV): The OBV has been fluctuating, indicating mixed buying and selling pressure.
- Chaikin Money Flow (CMF): The CMF has been negative, suggesting a bearish sentiment in the market.
Key Observations:
- The trend indicators point towards a bullish sentiment in the short term.
- Momentum indicators show a mixed picture with potential for a reversal or consolidation.
- Volatility indicators suggest a period of consolidation with stable volatility levels.
- Volume indicators indicate mixed buying and selling pressure with a bearish sentiment.
Conclusion:
Based on the analysis of the technical indicators, the next few days for FYBR could see sideways movement with a slight bullish bias. Traders should watch for potential reversals indicated by the stochastic oscillator and Williams %R, while also monitoring volume levels for confirmation of buying or selling pressure. It is advisable to exercise caution and wait for clearer signals before making significant trading decisions.