Technical Analysis of GBDC 2024-05-10
Overview:
In analyzing the technical indicators for GBDC over the last 5 days, we will delve into the trend, momentum, volatility, and volume indicators to provide a comprehensive outlook on the possible stock price movement. By examining these key factors, we aim to offer valuable insights and predictions for the upcoming days.
Trend Analysis:
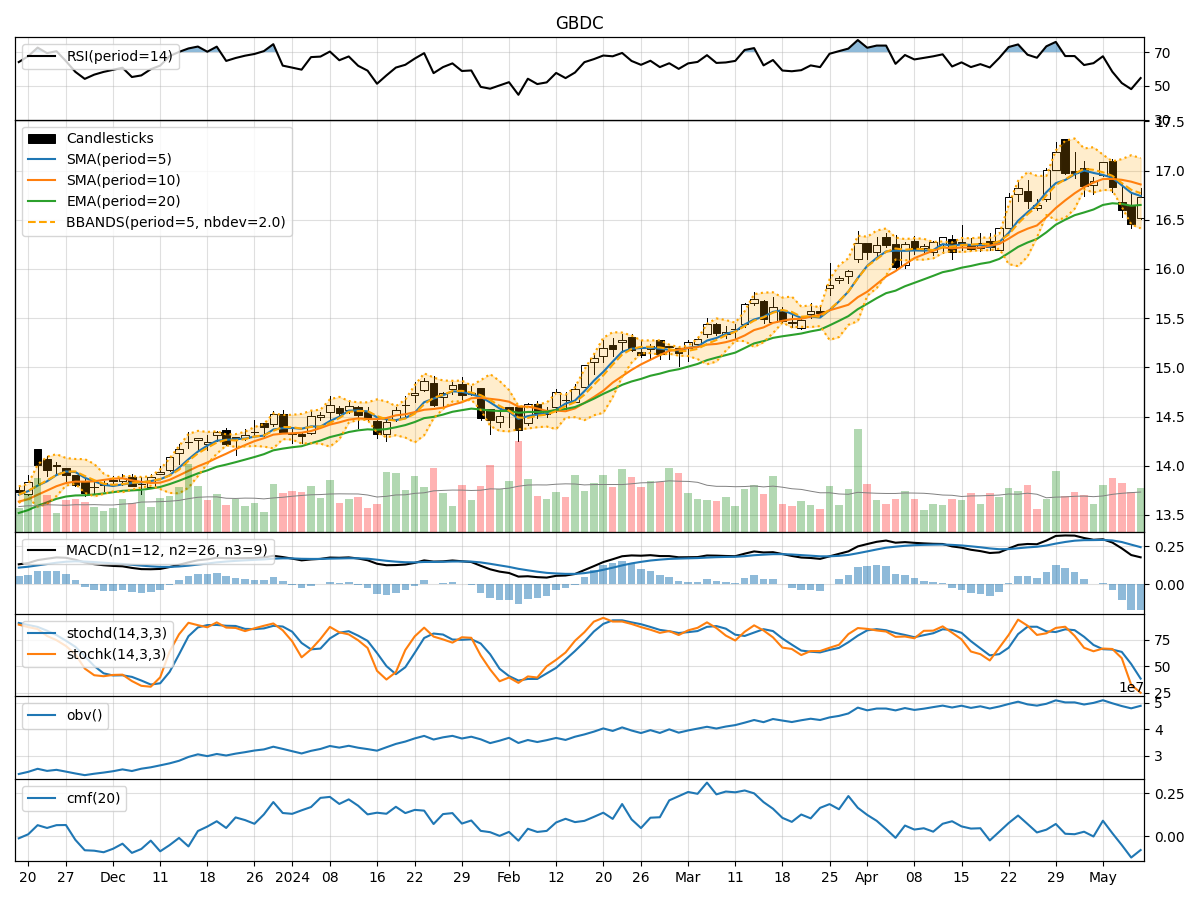
- Moving Averages (MA): The 5-day Moving Average (MA) has been fluctuating around the closing prices, indicating short-term price trends. The Simple Moving Average (SMA) and Exponential Moving Average (EMA) have shown slight variations but have generally been close to each other.
- MACD: The Moving Average Convergence Divergence (MACD) has been positive but decreasing, suggesting a potential slowdown in the uptrend.
- Conclusion: The trend indicators suggest a sideways movement in the stock price in the near future.
Momentum Analysis:
- RSI: The Relative Strength Index (RSI) has been fluctuating around the mid-level, indicating a balanced momentum between buying and selling pressure.
- Stochastic Oscillator: Both %K and %D have been declining, pointing towards a weakening momentum.
- Conclusion: The momentum indicators suggest a bearish sentiment in the stock price movement ahead.
Volatility Analysis:
- Bollinger Bands (BB): The Bollinger Bands have been narrowing, indicating decreasing volatility in the stock price.
- Conclusion: The volatility indicators suggest a low volatility environment in the upcoming days.
Volume Analysis:
- On-Balance Volume (OBV): The OBV has shown mixed movements, reflecting indecision among investors.
- Chaikin Money Flow (CMF): The CMF has been negative, indicating selling pressure in the market.
- Conclusion: The volume indicators suggest a bearish sentiment prevailing in the stock.
Overall Conclusion:
Based on the analysis of trend, momentum, volatility, and volume indicators, the overall outlook for GBDC in the next few days is bearish. The trend indicators point towards a sideways movement, while the momentum indicators suggest a weakening momentum with a bearish sentiment. Additionally, the low volatility environment and negative volume indicators further support the bearish view.
Recommendation:
Considering the bearish outlook, investors may consider adopting a cautious approach or potentially look for short-term trading opportunities to capitalize on the expected downward movement in GBDC's stock price. It is advisable to closely monitor the evolving market dynamics and adjust strategies accordingly to mitigate risks and optimize returns.