Technical Analysis of GDS 2024-05-10
Overview:
In analyzing the technical indicators for GDS over the last 5 days, we will delve into the trend, momentum, volatility, and volume indicators to provide a comprehensive outlook on the possible stock price movement in the coming days.
Trend Analysis:
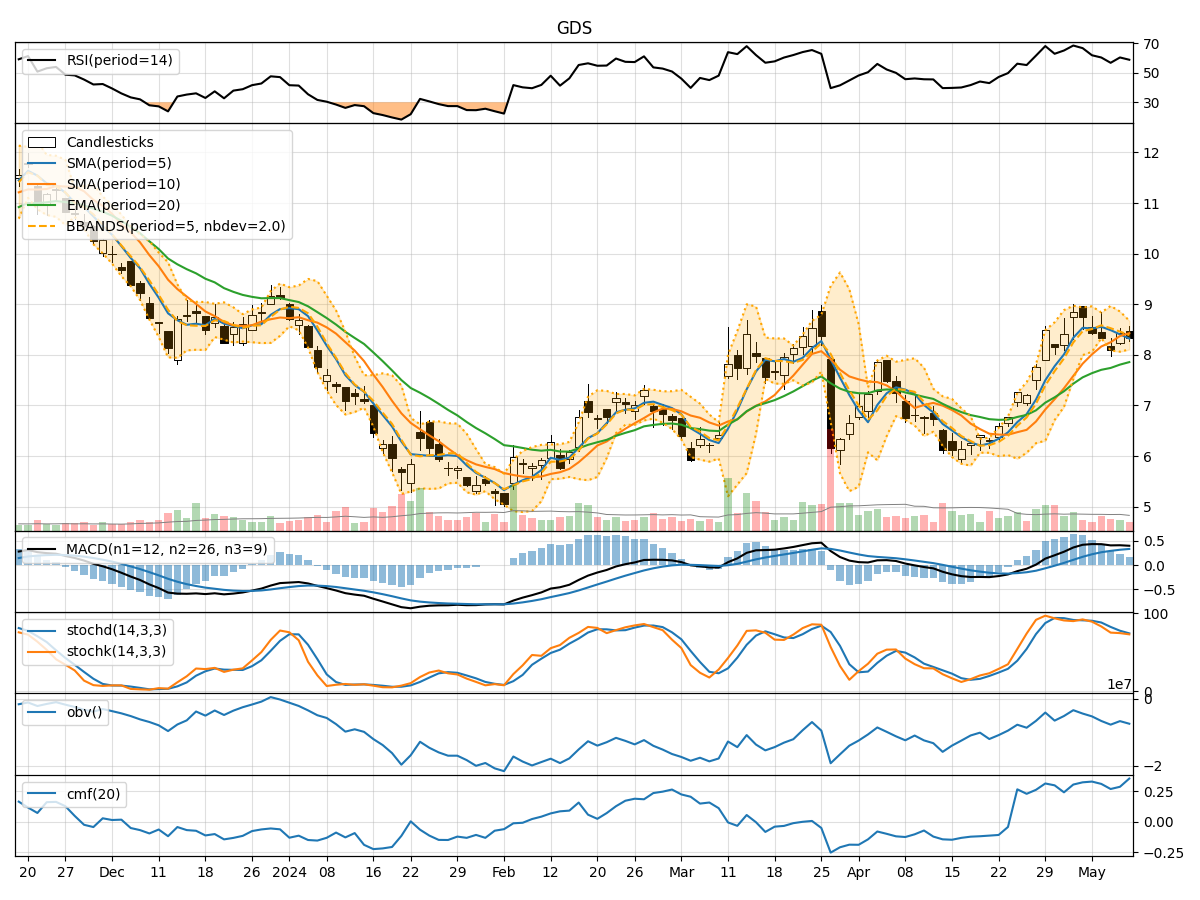
- Moving Averages (MA): The 5-day Moving Average (MA) has been fluctuating around the closing prices, indicating short-term price trends. The Simple Moving Average (SMA) and Exponential Moving Average (EMA) show an overall upward trend, with the EMA slightly lagging behind.
- MACD: The Moving Average Convergence Divergence (MACD) has been positive, suggesting bullish momentum in the stock price.
Momentum Analysis:
- RSI: The Relative Strength Index (RSI) has been oscillating around the 50 level, indicating a balanced momentum between buying and selling pressure.
- Stochastic Oscillator: Both %K and %D have been gradually decreasing, signaling a potential reversal in momentum.
Volatility Analysis:
- Bollinger Bands (BB): The Bollinger Bands have been narrowing, indicating decreasing volatility in the stock price.
Volume Analysis:
- On-Balance Volume (OBV): The OBV has been relatively stable, suggesting a balance between buying and selling volume.
- Chaikin Money Flow (CMF): The CMF has shown a slight increase, indicating a potential inflow of money into the stock.
Key Observations:
- The stock has been trading within a narrow range, with indicators showing mixed signals.
- The moving averages suggest a potential uptrend, supported by the positive MACD.
- Momentum indicators are neutral to slightly bearish, hinting at a possible consolidation phase.
- Volatility has been decreasing, indicating a period of price stability.
- Volume indicators show a balanced market sentiment with a slight increase in buying pressure.
Conclusion:
Based on the analysis of technical indicators, the stock price of GDS is likely to experience sideways movement in the next few days. The upward trend indicated by moving averages and MACD is countered by the neutral to bearish momentum signals from RSI and Stochastic Oscillator. The decreasing volatility and balanced volume further support the view of a consolidation phase. Therefore, investors should exercise caution and closely monitor the price action for potential breakout or reversal signals.