Technical Analysis of GEHC 2024-05-10
Overview:
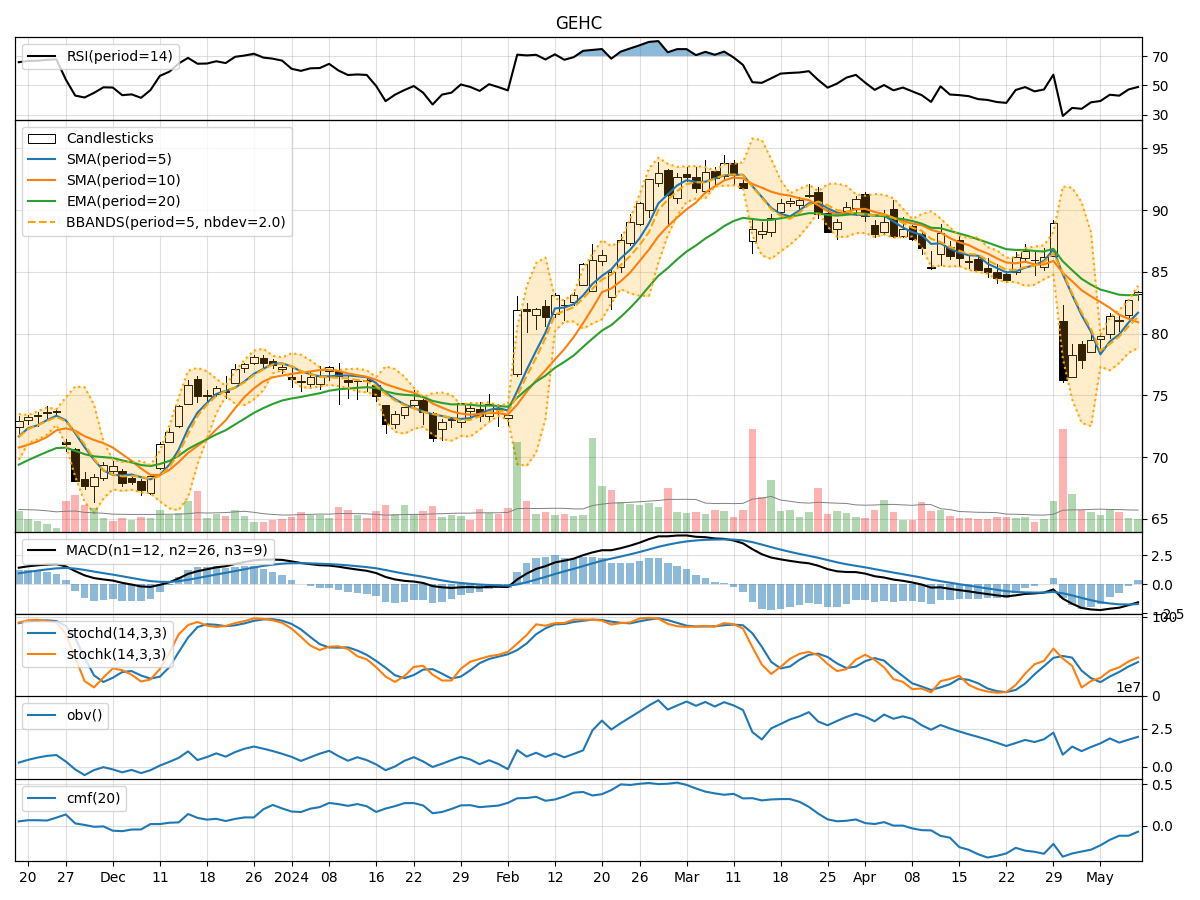
In analyzing the technical indicators for GEHC over the last 5 days, we will delve into the trend, momentum, volatility, and volume indicators to provide a comprehensive outlook on the possible stock price movement in the coming days.
Trend Indicators:
- Moving Averages (MA): The 5-day MA has been fluctuating around the closing prices, indicating short-term price trends. The SMA(10) and EMA(20) show a downward trend, suggesting a bearish sentiment in the medium to long term.
- MACD: The MACD line has been consistently below the signal line, indicating a bearish trend in the stock price momentum.
- MACD Histogram: The MACD histogram has been negative, further confirming the bearish momentum in the stock.
Momentum Indicators:
- RSI: The RSI has been below 50, indicating a bearish momentum in the stock price.
- Stochastic Oscillator: Both %K and %D have been below 50, suggesting a bearish sentiment in the stock.
- Williams %R: The Williams %R has been in the oversold territory, indicating a bearish sentiment.
Volatility Indicators:
- Bollinger Bands: The stock price has been trading within the lower Bollinger Band, suggesting a possible oversold condition.
- Bollinger %B: The %B indicator has been below 1, indicating a potential buying opportunity as the stock may be undervalued.
Volume Indicators:
- On-Balance Volume (OBV): The OBV has been fluctuating, indicating mixed buying and selling pressure in the stock.
- Chaikin Money Flow (CMF): The CMF has been negative, suggesting a bearish sentiment in the stock.
Key Observations:
- The trend indicators, momentum indicators, and volatility indicators all point towards a bearish sentiment in the stock price movement.
- The stock is currently oversold according to the Williams %R and Bollinger Bands, indicating a potential reversal or buying opportunity.
- The volume indicators show mixed buying and selling pressure, reflecting uncertainty in the market sentiment.
Conclusion:
Based on the analysis of the technical indicators, the next few days' possible stock price movement for GEHC is likely to be bearish. The stock shows signs of weakness in trend, momentum, and volatility, indicating a potential downward trend. Traders and investors should exercise caution and consider waiting for a more favorable entry point before considering any long positions.