Technical Analysis of GGR 2024-05-10
Overview:
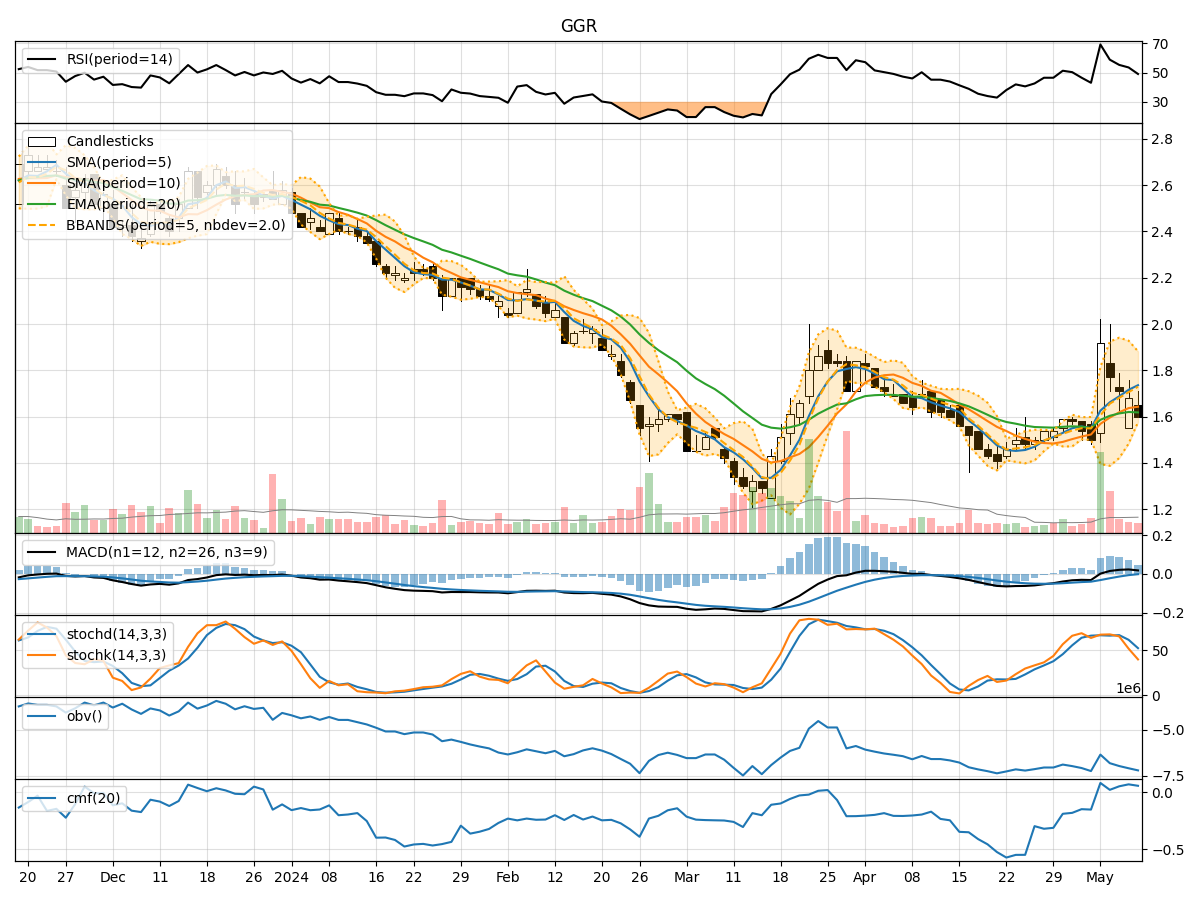
In analyzing the technical indicators for GGR over the last 5 days, we will delve into the trend, momentum, volatility, and volume indicators to provide a comprehensive outlook on the possible stock price movement in the coming days.
Trend Analysis:
- Moving Averages (MA): The 5-day MA has been trending above the closing prices, indicating a short-term bullish trend.
- MACD: The MACD line has been consistently above the signal line, suggesting bullish momentum.
- EMA: The EMA has been steadily increasing, reflecting a positive trend.
Momentum Analysis:
- RSI: The RSI has been declining but remains above the oversold threshold, indicating a potential reversal.
- Stochastic Oscillator: Both %K and %D have been decreasing, signaling a bearish momentum.
- Williams %R: The indicator has been in oversold territory, suggesting a potential buying opportunity.
Volatility Analysis:
- Bollinger Bands (BB): The stock price has been trading within the bands, indicating normal volatility.
- BB Width: The width of the bands has been narrowing, suggesting a potential decrease in volatility.
Volume Analysis:
- On-Balance Volume (OBV): The OBV has been declining, indicating selling pressure.
- Chaikin Money Flow (CMF): The CMF has been positive but decreasing, signaling a potential outflow of money.
Key Observations:
- The trend indicators suggest a bullish sentiment in the short term.
- Momentum indicators show conflicting signals, with RSI indicating a potential reversal while stochastic oscillators signal bearish momentum.
- Volatility has been decreasing, indicating a possible consolidation phase.
- Volume indicators point towards selling pressure and a potential outflow of money.
Conclusion:
Based on the analysis of the technical indicators, the next few days for GGR stock price movement could be sideways with a slight bearish bias. The conflicting signals from momentum indicators and the decrease in volume and volatility suggest a period of consolidation. Traders should exercise caution and wait for clearer signals before making significant trading decisions.