Technical Analysis of GLAC 2024-05-10
Overview:
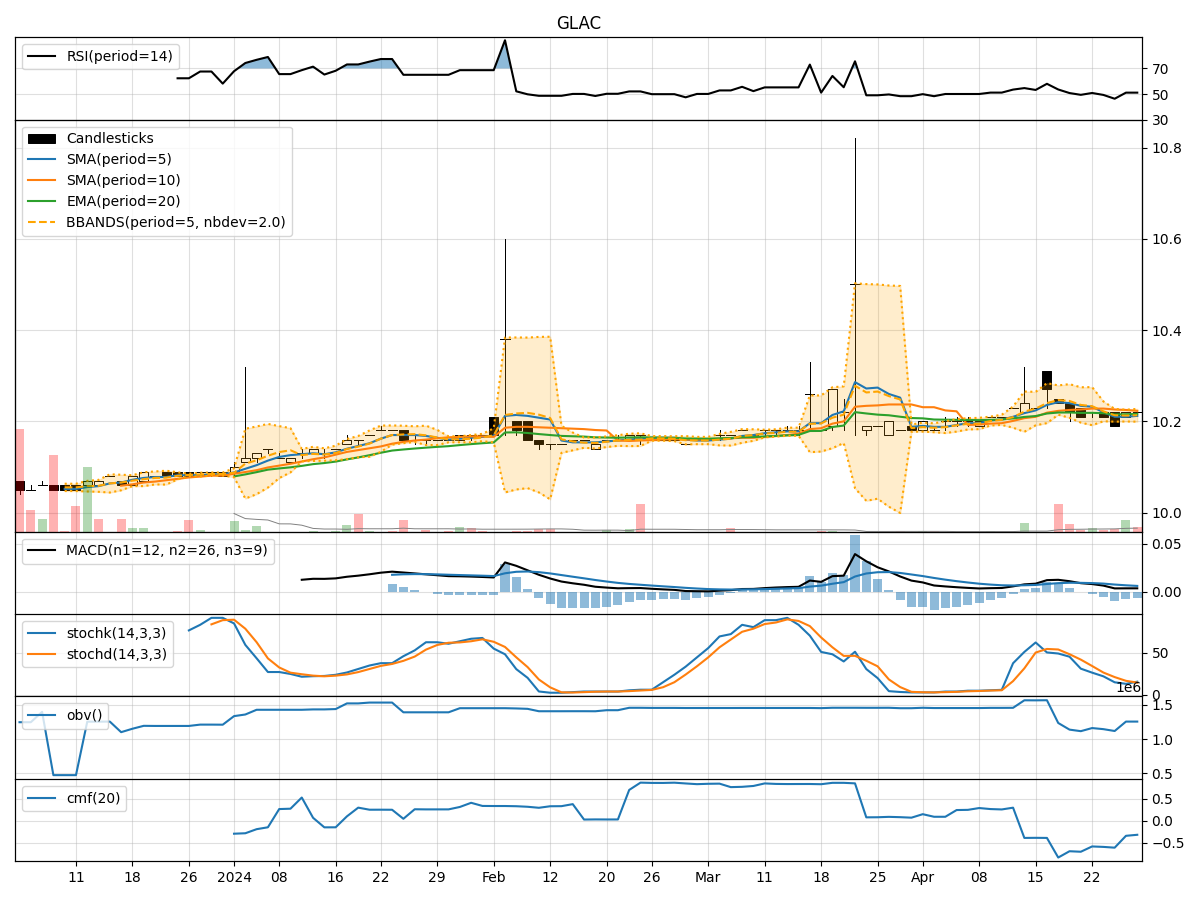
In analyzing the technical indicators for GLAC over the last 5 days, we will delve into the trend, momentum, volatility, and volume indicators to provide a comprehensive outlook on the possible stock price movement. By examining these key aspects, we aim to offer valuable insights and predictions for the upcoming days.
Trend Analysis:
- Moving Averages (MA): The 5-day MA has been relatively stable around the current price, indicating a neutral trend.
- MACD: The MACD line has shown a slight positive trend, with the MACD histogram also displaying an uptrend.
- EMA: The EMA has been gradually increasing, suggesting a bullish sentiment in the short term.
Momentum Analysis:
- RSI: The RSI has been hovering around the neutral zone, indicating a lack of strong momentum.
- Stochastic Oscillator: Both %K and %D have shown mixed signals, with %K crossing %D, suggesting potential bullish momentum.
- Williams %R: The indicator has been fluctuating near oversold levels, signaling a possible reversal.
Volatility Analysis:
- Bollinger Bands (BB): The bands have remained relatively narrow, indicating low volatility and a period of consolidation.
- BB %B: The %B indicator has shown fluctuations within a tight range, reflecting a lack of significant price movement.
Volume Analysis:
- On-Balance Volume (OBV): The OBV has been in a downtrend, suggesting selling pressure in the stock.
- Chaikin Money Flow (CMF): The CMF has been negative, indicating a lack of buying interest and potential bearish sentiment.
Key Observations:
- The trend indicators suggest a mildly bullish sentiment in the short term.
- Momentum indicators show mixed signals, with a potential for bullish momentum.
- Volatility remains low, indicating a period of consolidation.
- Volume indicators point towards selling pressure and a lack of buying interest.
Conclusion:
Based on the analysis of the technical indicators, the next few days for GLAC could see sideways movement with a slight bullish bias. Traders should exercise caution and closely monitor key levels for potential breakout or breakdown scenarios. It is advisable to wait for clearer signals from the indicators before making significant trading decisions.