Technical Analysis of GLNG 2024-05-10
Overview:
In analyzing the technical indicators for GLNG over the last 5 days, we will delve into the trend, momentum, volatility, and volume indicators to provide a comprehensive outlook on the possible stock price movement in the coming days. By examining these key aspects, we aim to offer valuable insights and predictions for potential investors and traders.
Trend Analysis:
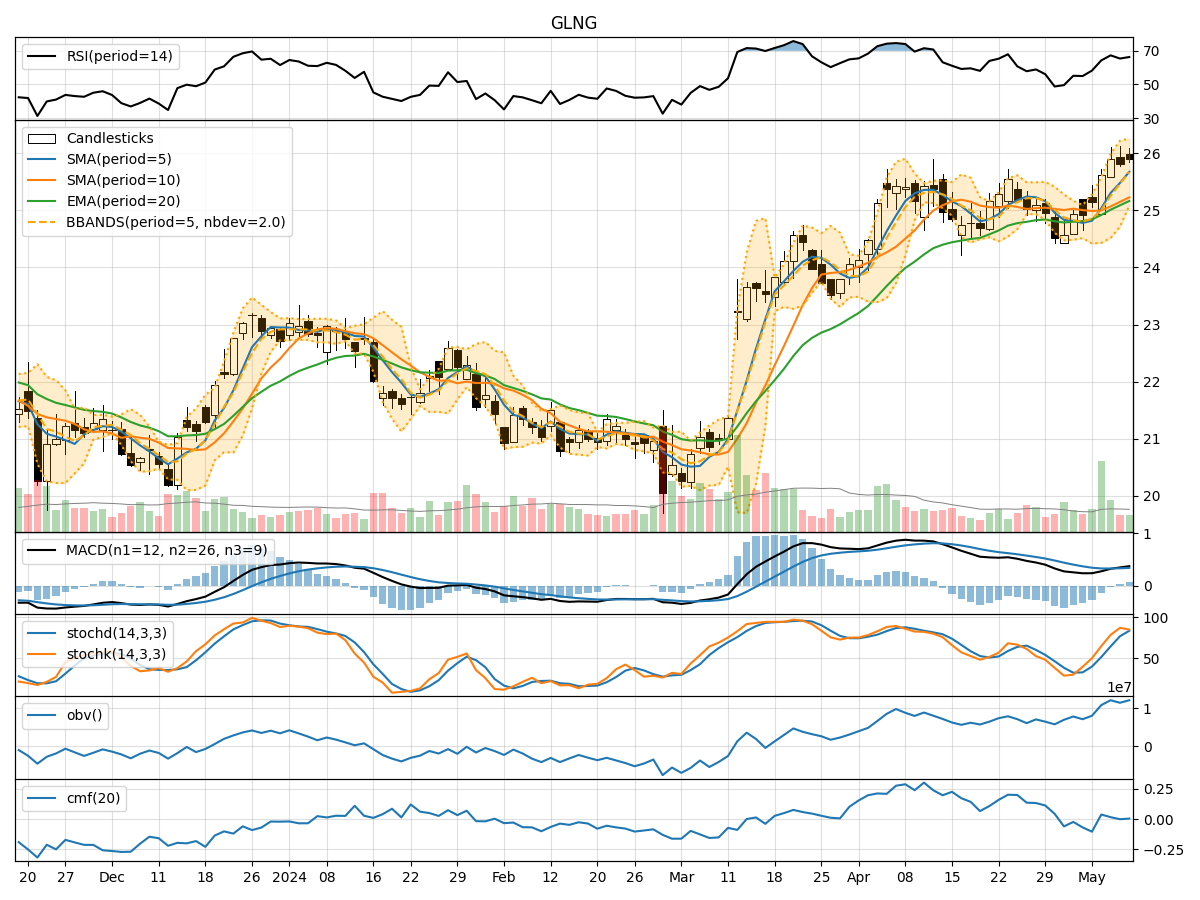
- Moving Averages (MA): The 5-day Moving Average (MA) has been consistently rising, indicating an upward trend in the stock price.
- MACD: The MACD line has been above the signal line for the past few days, suggesting bullish momentum.
- RSI: The Relative Strength Index (RSI) has been hovering around 60-70, indicating a neutral to slightly bullish sentiment.
Momentum Analysis:
- Stochastic Oscillator: Both %K and %D have been in the overbought territory, signaling a potential reversal or consolidation.
- Williams %R: The Williams %R is also in the overbought region, suggesting a possible pullback in the stock price.
Volatility Analysis:
- Bollinger Bands: The Bollinger Bands have been widening, indicating increased volatility in the stock price.
- Volatility Bands: The volatility bands have been expanding, suggesting potential price swings in the near future.
Volume Analysis:
- On-Balance Volume (OBV): The OBV has been relatively flat, indicating a balance between buying and selling pressure.
- Chaikin Money Flow (CMF): The CMF has been slightly positive, suggesting some accumulation in the stock.
Key Observations:
- The trend indicators point towards a bullish sentiment in the stock price.
- Momentum indicators suggest a potential reversal or consolidation due to overbought conditions.
- Volatility indicators indicate increased price swings in the near future.
- Volume indicators show a balance between buying and selling pressure.
Conclusion:
Based on the analysis of the technical indicators, the stock price of GLNG is likely to experience some consolidation or a minor pullback in the coming days after the recent bullish trend. Traders should be cautious of the overbought conditions indicated by the momentum indicators and the potential price swings highlighted by the volatility indicators. It is advisable to wait for a clearer signal or confirmation before making any significant trading decisions.