Technical Analysis of GMAB 2024-05-10
Overview:
In analyzing the technical indicators for GMAB over the last 5 days, we will delve into the trend, momentum, volatility, and volume indicators to provide a comprehensive outlook on the possible stock price movement in the coming days. By examining these key aspects, we aim to offer valuable insights and predictions to guide investment decisions.
Trend Indicators:
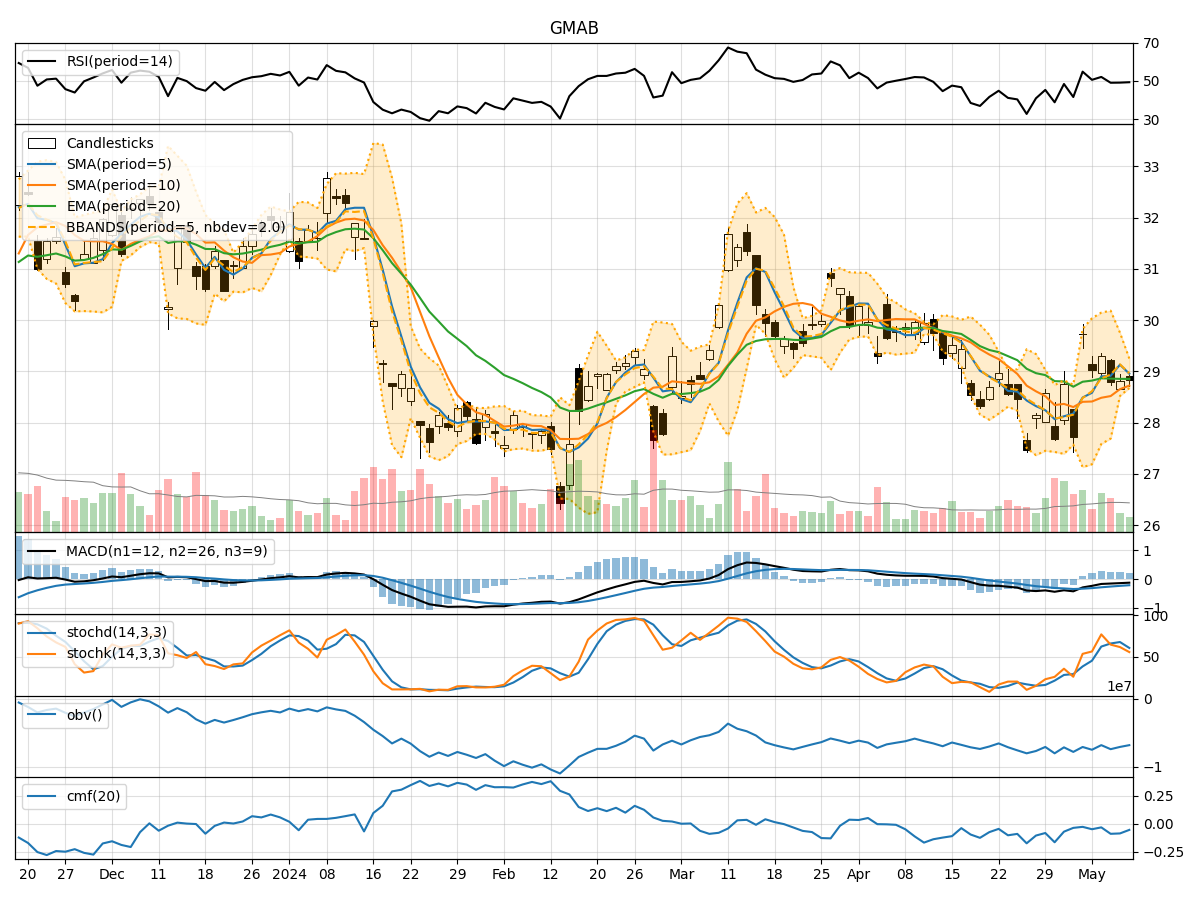
- Moving Averages (MA): The 5-day Moving Average (MA) has been fluctuating around the Simple Moving Average (SMA) and Exponential Moving Average (EMA) values, indicating a lack of clear trend direction.
- MACD: The MACD line has been consistently below the signal line, suggesting a bearish momentum in the short term.
- MACD Histogram: The MACD Histogram has been decreasing, indicating a weakening bearish momentum.
Momentum Indicators:
- RSI: The Relative Strength Index (RSI) has been hovering around the neutral zone, indicating a balanced momentum between buying and selling pressure.
- Stochastic Oscillator: Both %K and %D values have been fluctuating, reflecting indecision in the market.
- Williams %R: The Williams %R is in the oversold territory, suggesting a potential reversal in the short term.
Volatility Indicators:
- Bollinger Bands: The Bollinger Bands have been narrowing, indicating decreasing volatility and a potential breakout in the near future.
- Bollinger %B: The %B value has been fluctuating within a tight range, signaling a period of consolidation.
Volume Indicators:
- On-Balance Volume (OBV): The OBV has been fluctuating, indicating mixed buying and selling pressure.
- Chaikin Money Flow (CMF): The CMF has been negative, suggesting a lack of strong buying interest in the stock.
Key Observations and Opinions:
- Trend: The trend indicators show a lack of clear direction, with the stock trading within a range.
- Momentum: Momentum indicators suggest a neutral stance with a slight bearish bias.
- Volatility: Volatility has been decreasing, indicating a potential period of consolidation.
- Volume: Volume indicators reflect mixed participation from investors, leading to uncertainty in market sentiment.
Conclusion:
Based on the analysis of the technical indicators, the stock price of GMAB is likely to experience sideways movement in the coming days. The lack of a clear trend direction, coupled with neutral momentum and decreasing volatility, suggests a period of consolidation. Investors should exercise caution and closely monitor key support and resistance levels for potential breakout opportunities.