Technical Analysis of GNFT 2024-05-10
Overview:
In analyzing the technical indicators for GNFT over the last 5 days, we will delve into the trend, momentum, volatility, and volume indicators to provide a comprehensive outlook on the possible stock price movement in the coming days. By examining these key aspects, we aim to offer valuable insights and recommendations for potential investors.
Trend Analysis:
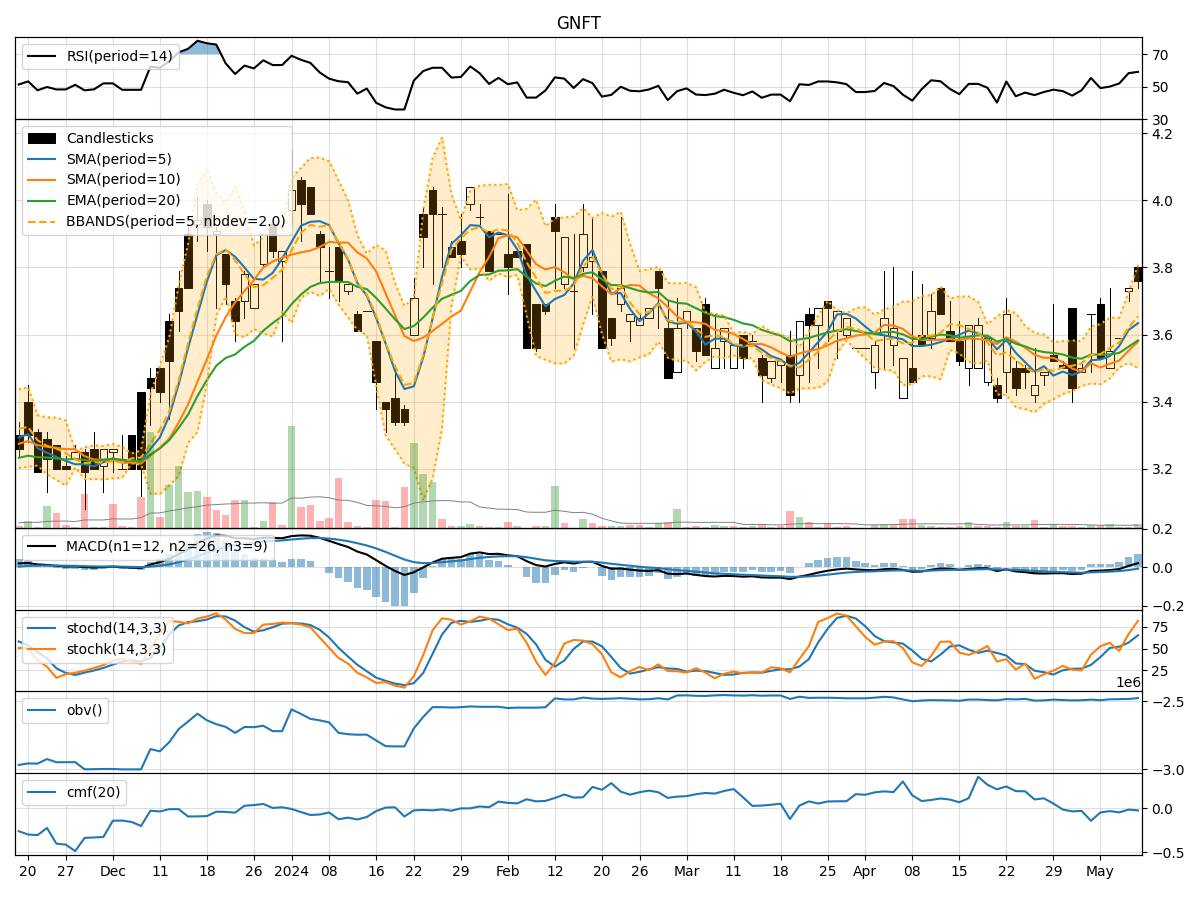
- Moving Averages (MA): The 5-day Moving Average (MA) has been showing an upward trend, indicating a positive momentum in the stock price.
- MACD: The Moving Average Convergence Divergence (MACD) has been consistently increasing, suggesting a strengthening bullish trend.
- EMA: The Exponential Moving Average (EMA) has also been on the rise, supporting the bullish sentiment in the short to medium term.
Momentum Analysis:
- RSI: The Relative Strength Index (RSI) has been gradually increasing, reflecting a growing buying pressure in the market.
- Stochastic Oscillator: Both %K and %D values have been rising, indicating an uptrend in momentum.
- Williams %R: The Williams %R is in the oversold territory, suggesting a potential reversal or consolidation phase.
Volatility Analysis:
- Bollinger Bands (BB): The Bollinger Bands have been widening, indicating increased volatility in the stock price.
- BB %B: The %B value has been fluctuating within a moderate range, signifying potential price swings in the near future.
Volume Analysis:
- On-Balance Volume (OBV): The OBV has been showing a slight increase, suggesting a positive accumulation of the stock.
- Chaikin Money Flow (CMF): The CMF has been negative, indicating some selling pressure in the market.
Key Observations:
- The trend indicators suggest a strong bullish sentiment in the stock price.
- Momentum indicators point towards a continuation of the upward momentum.
- Volatility indicators indicate potential price swings in the near future.
- Volume indicators show a mixed signal with slight accumulation but some selling pressure.
Conclusion:
Based on the analysis of the technical indicators, the stock price of GNFT is likely to continue its upward trajectory in the coming days. The bullish trend supported by moving averages, MACD, and RSI signals a positive outlook for investors. However, the increasing volatility and mixed volume signals suggest potential price fluctuations and the need for cautious monitoring. Overall, the technical analysis indicates a bullish view for GNFT in the short to medium term. Investors may consider capitalizing on the current momentum but should remain vigilant of any sudden shifts in market dynamics.