Technical Analysis of GNSS 2024-05-31
Overview:
In analyzing the technical indicators for GNSS over the last 5 days, we will delve into the trend, momentum, volatility, and volume indicators to provide a comprehensive outlook on the possible stock price movement in the coming days. By examining these key indicators, we aim to offer valuable insights and predictions for potential investors.
Trend Analysis:
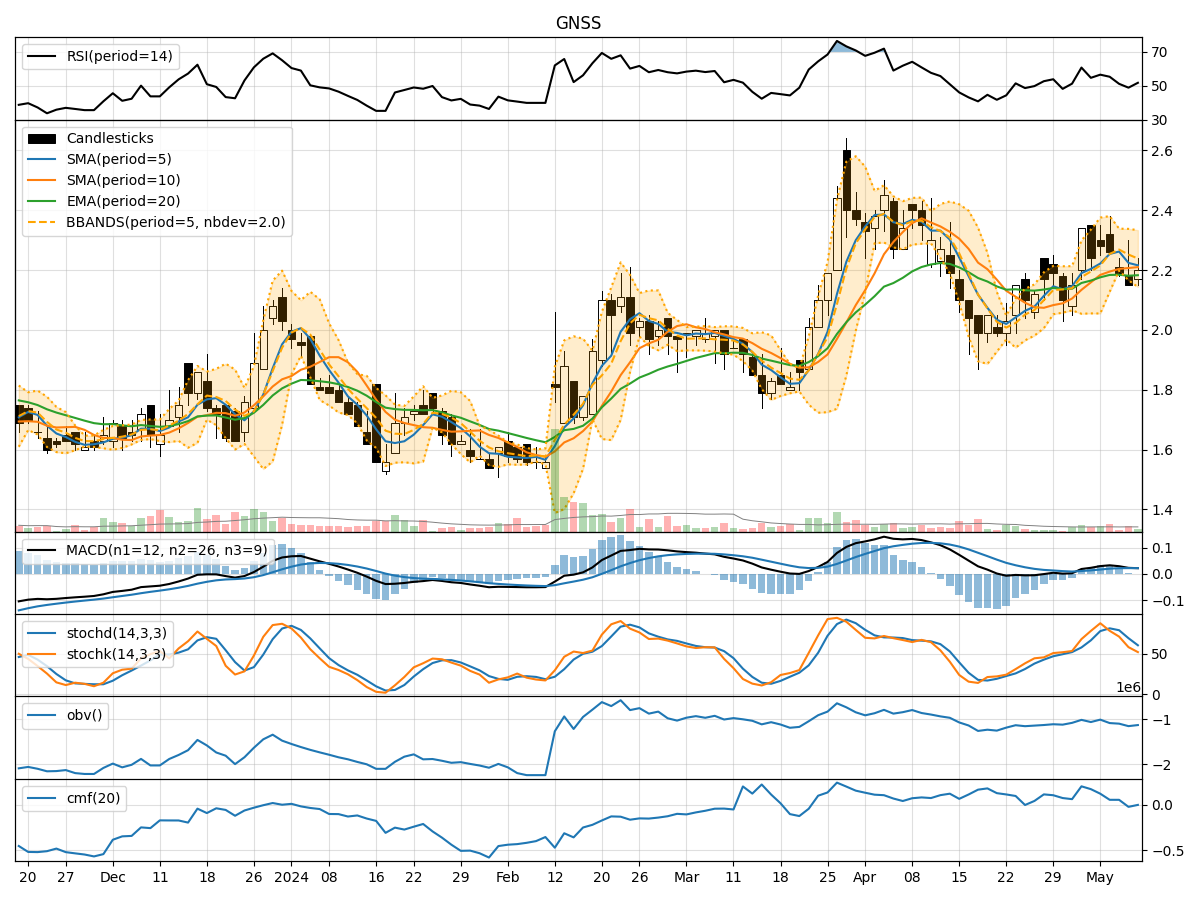
- Moving Averages (MA): The 5-day moving average has been fluctuating around the closing prices, indicating short-term price trends. The Simple Moving Average (SMA) and Exponential Moving Average (EMA) show a downward trend, suggesting a bearish sentiment.
- MACD: The Moving Average Convergence Divergence indicates a negative trend with the MACD line consistently below the signal line, signaling a bearish momentum.
- MACD Histogram: The MACD Histogram has been decreasing, further confirming the bearish momentum in the stock.
Momentum Analysis:
- RSI: The Relative Strength Index has been hovering around 40-42, indicating a neutral stance with a slight bearish bias.
- Stochastic Oscillator: Both %K and %D lines of the Stochastic Oscillator are below 50, suggesting a bearish momentum.
- Williams %R: The Williams %R is in the oversold territory, indicating a bearish sentiment in the market.
Volatility Analysis:
- Bollinger Bands: The Bollinger Bands are narrowing, indicating decreasing volatility in the stock price. The bands are squeezing around the price, suggesting a potential breakout in either direction.
- Bollinger %B: The %B indicator is below 1, indicating that the stock price is trading below the lower Bollinger Band, signaling a possible oversold condition.
Volume Analysis:
- On-Balance Volume (OBV): The OBV has been declining, suggesting that selling pressure has been dominant in the market.
- Chaikin Money Flow (CMF): The CMF is negative, indicating that money is flowing out of the stock, reflecting bearish sentiment.
Conclusion:
Based on the analysis of the technical indicators, the overall outlook for GNSS in the next few days is bearish. The trend indicators, momentum oscillators, and volume indicators all point towards a continuation of the current downward trend. The narrowing Bollinger Bands suggest a potential breakout, but the overall sentiment remains negative.
Key Points: - Direction: Downward - Trend: Bearish - Momentum: Bearish - Volatility: Decreasing - Volume: Bearish
Investors should exercise caution and consider waiting for a more favorable entry point or confirmation of a trend reversal before considering any long positions in GNSS.