Technical Analysis of GRWG 2024-05-10
Overview:
In analyzing the technical indicators for GRWG over the last 5 days, we will delve into the trend, momentum, volatility, and volume indicators to provide a comprehensive outlook on the possible stock price movement. By examining these key aspects, we aim to offer valuable insights and predictions for the upcoming days.
Trend Analysis:
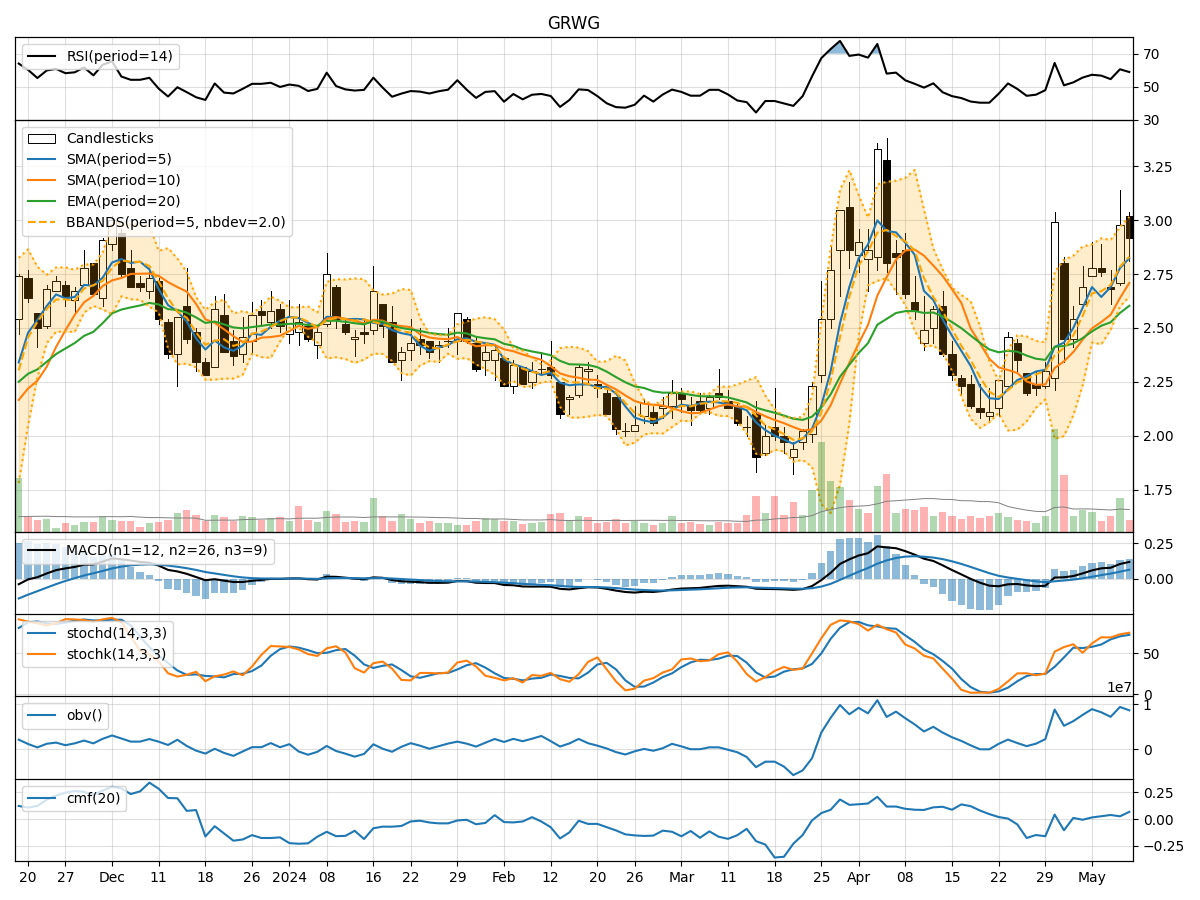
- Moving Averages (MA): The 5-day Moving Average (MA) has been fluctuating around the current price, indicating short-term price stability.
- MACD: The Moving Average Convergence Divergence (MACD) shows a positive trend with the MACD line consistently above the signal line, suggesting bullish momentum.
- EMA: The Exponential Moving Average (EMA) has been on an upward trajectory, reflecting a positive price trend.
Key Observation: The trend indicators suggest a bullish sentiment in the short term.
Momentum Analysis:
- RSI: The Relative Strength Index (RSI) has been oscillating around the neutral level of 50, indicating a balanced momentum.
- Stochastic Oscillator: Both %K and %D of the Stochastic Oscillator are in the overbought zone, signaling a potential reversal.
- Williams %R: The Williams %R is in the oversold territory, hinting at a possible buying opportunity.
Key Observation: Momentum indicators are mixed, with a slight bias towards a bearish reversal.
Volatility Analysis:
- Bollinger Bands: The Bollinger Bands are widening, suggesting increased price volatility.
- Bollinger %B: The %B indicator is hovering around 0.5, indicating a neutral stance.
- Average True Range (ATR): The ATR has shown an uptick, reflecting rising volatility levels.
Key Observation: Volatility indicators point towards heightened market fluctuations in the near term.
Volume Analysis:
- On-Balance Volume (OBV): The OBV has been relatively stable, indicating a balance between buying and selling pressure.
- Chaikin Money Flow (CMF): The CMF is positive, suggesting inflows into the stock over the past 20 days.
Key Observation: Volume indicators imply a neutral stance with a slight bullish bias.
Conclusion:
Based on the analysis of the technical indicators, the next few days for GRWG could see increased volatility with a bullish bias in the short term. While the trend indicators signal a positive outlook, the momentum indicators hint at a potential bearish reversal. It is essential to monitor the price action closely, especially around key support and resistance levels, to confirm the direction of the stock.
Overall Assessment: The stock is likely to experience upward price movement in the coming days, but traders should remain cautious of a possible reversal in momentum. It is advisable to set stop-loss levels and closely monitor the evolving market dynamics to make informed trading decisions.