Technical Analysis of GSIW 2024-05-10
Overview:
In analyzing the technical indicators for GSIW stock over the last 5 days, we will delve into the trend, momentum, volatility, and volume indicators to provide a comprehensive outlook on the possible stock price movement in the coming days. By examining these key indicators, we aim to offer valuable insights and predictions for potential investors.
Trend Analysis:
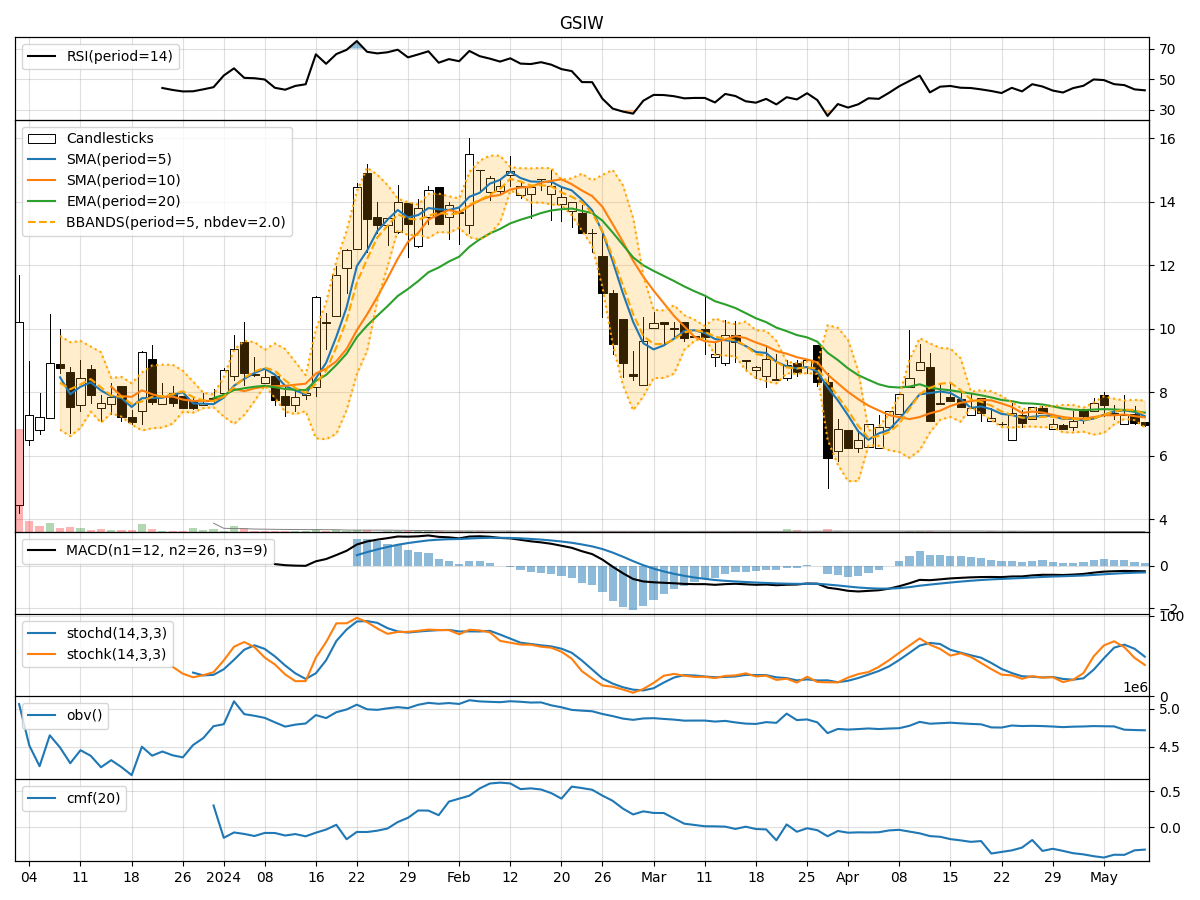
- Moving Averages (MA): The 5-day Moving Average (MA) has been declining steadily, indicating a bearish trend in the short term.
- MACD: The Moving Average Convergence Divergence (MACD) has been negative, suggesting a bearish momentum in the stock price.
- EMA: The Exponential Moving Average (EMA) has also been decreasing, reinforcing the bearish sentiment in the stock.
Key Observation: The trend indicators point towards a bearish outlook for GSIW stock in the short term.
Momentum Analysis:
- RSI: The Relative Strength Index (RSI) has been decreasing, indicating a weakening momentum in the stock.
- Stochastic Oscillator: Both %K and %D of the Stochastic Oscillator have been declining, signaling a bearish momentum.
- Williams %R: The Williams %R is in the oversold territory, suggesting a potential reversal or continuation of the downtrend.
Key Observation: Momentum indicators align with the bearish trend, indicating a potential continuation of downward movement.
Volatility Analysis:
- Bollinger Bands: The Bollinger Bands have been narrowing, indicating decreasing volatility in the stock price.
- Bollinger %B: The %B indicator is below 0.2, suggesting the stock is oversold.
- Average True Range (ATR): The ATR has been decreasing, indicating lower volatility in the stock.
Key Observation: Volatility indicators suggest a decrease in price fluctuations, potentially leading to a period of consolidation or a reversal.
Volume Analysis:
- On-Balance Volume (OBV): The OBV has been declining, indicating selling pressure in the stock.
- Chaikin Money Flow (CMF): The CMF has been negative, suggesting outflow of money from the stock.
Key Observation: Volume indicators support the bearish sentiment, indicating a lack of buying interest and potential further downside.
Conclusion:
Based on the analysis of trend, momentum, volatility, and volume indicators, the overall outlook for GSIW stock is bearish in the near term. The stock is likely to experience continued downward pressure, with a potential for further decline in price. Investors should exercise caution and consider waiting for a more favorable entry point or implementing risk management strategies in case of a reversal.