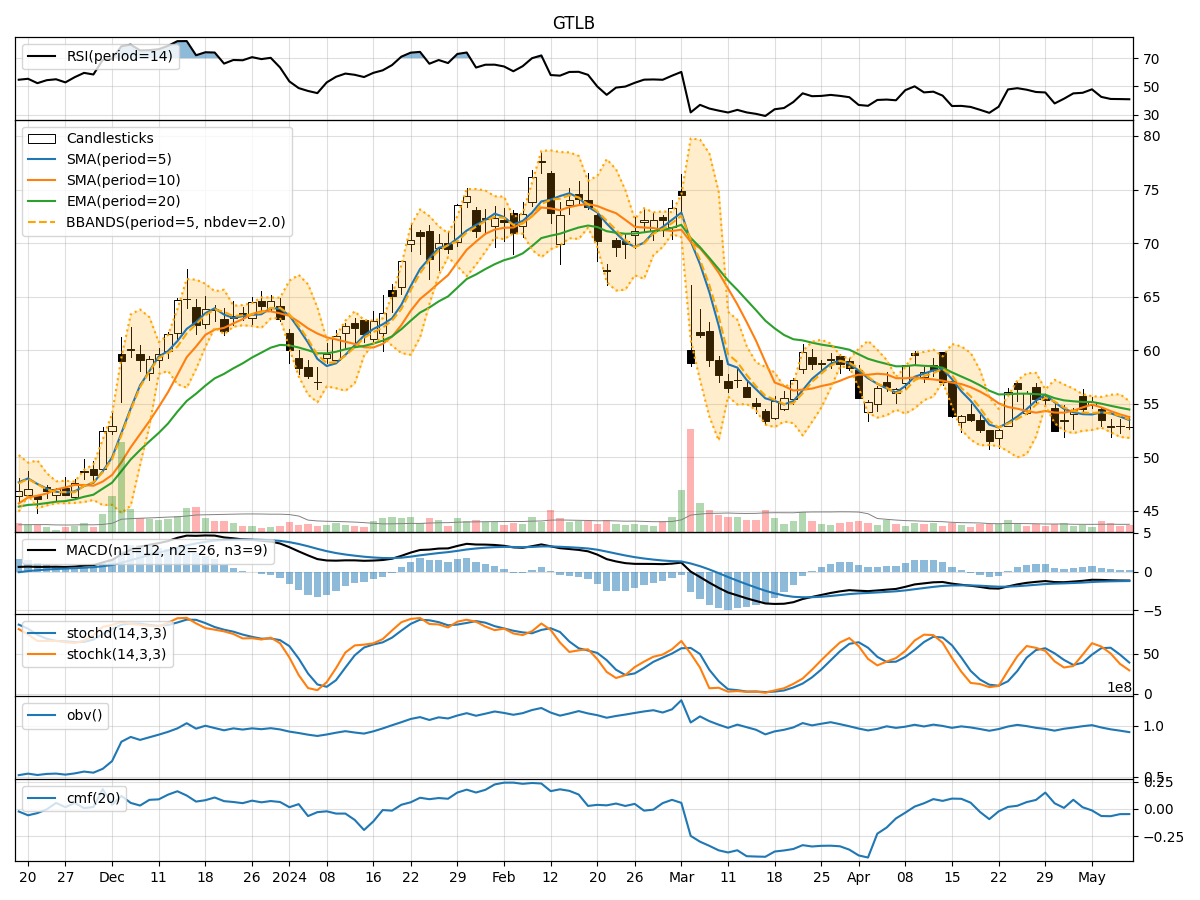
Technical Analysis of GTLB 2024-05-10
Overview:
In analyzing the technical indicators for GTLB over the last 5 days, we will delve into the trend, momentum, volatility, and volume indicators to provide a comprehensive outlook on the possible stock price movement in the coming days. By examining these key indicators, we aim to offer valuable insights and predictions for informed decision-making.
Trend Analysis:
- Moving Averages (MA): The 5-day MA has been consistently below the closing prices, indicating a short-term downtrend.
- MACD: The MACD line has been negative, suggesting bearish momentum in the stock.
- EMA: The EMA has been declining, reflecting a weakening trend.
Key Observation: The trend indicators point towards a downward trend in the stock price.
Momentum Analysis:
- RSI: The RSI has been decreasing, indicating a loss in bullish momentum.
- Stochastic Oscillator: Both %K and %D have been declining, signaling a potential oversold condition.
- Williams %R: The indicator has been in the oversold territory, suggesting a possible reversal.
Key Observation: Momentum indicators suggest a bearish sentiment in the stock.
Volatility Analysis:
- Bollinger Bands (BB): The stock price has been trading within the lower Bollinger Band, indicating a potential oversold condition.
- Bollinger %B: The %B is below 1, suggesting the stock is trading at the lower end of its recent price range.
Key Observation: Volatility indicators imply a potential reversal or consolidation in the stock price.
Volume Analysis:
- On-Balance Volume (OBV): The OBV has been declining, indicating selling pressure in the stock.
- Chaikin Money Flow (CMF): The CMF has been negative, suggesting a lack of buying interest.
Key Observation: Volume indicators reflect bearish sentiment and a lack of buying support.
Conclusion:
Based on the analysis of trend, momentum, volatility, and volume indicators, the overall outlook for GTLB stock in the next few days is bearish. The stock is likely to continue its downward trend with potential for a further decline in price. Traders and investors should exercise caution and consider waiting for more favorable conditions before considering any long positions.
Key Conclusion:
The technical analysis indicates a bearish outlook for GTLB stock in the coming days, with a high probability of further decline. It is advisable to monitor the stock closely for any signs of reversal before considering any bullish positions.