Technical Analysis of GV 2024-05-10
Overview:
In analyzing the technical indicators for GV stock over the last 5 days, we will delve into the trend, momentum, volatility, and volume indicators to provide a comprehensive outlook on the possible stock price movement in the coming days. By examining these key indicators, we aim to offer valuable insights and predictions for potential investors or traders.
Trend Analysis:
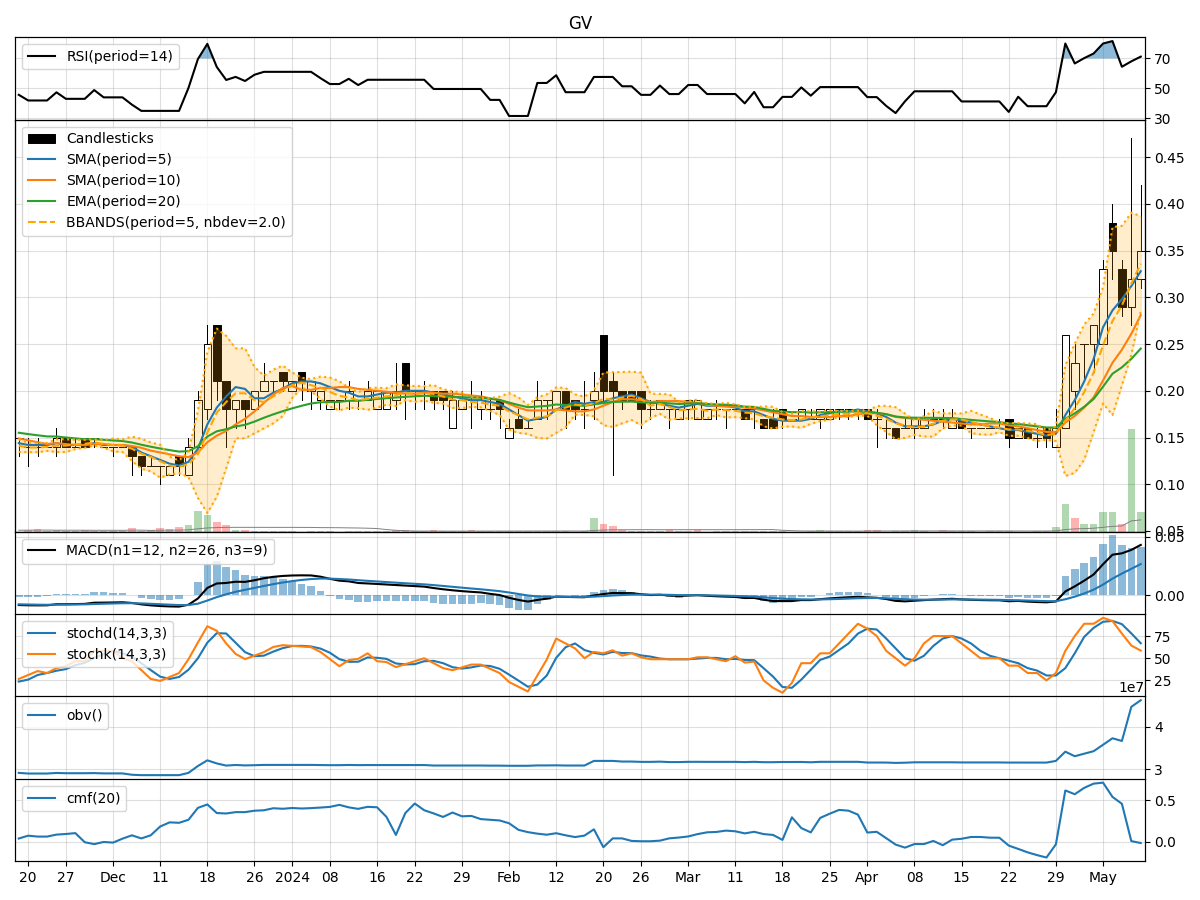
- Moving Averages (MA): The 5-day Moving Average (MA) has been consistently rising, indicating an upward trend in the stock price.
- MACD: The Moving Average Convergence Divergence (MACD) has also been increasing, suggesting bullish momentum in the stock.
Momentum Analysis:
- RSI: The Relative Strength Index (RSI) has been in the overbought territory, indicating a strong bullish momentum.
- Stochastic Oscillator: Both %K and %D have been declining but remain in the overbought zone, signaling a potential reversal or consolidation.
Volatility Analysis:
- Bollinger Bands (BB): The Bollinger Bands have been widening, indicating increased volatility in the stock price.
Volume Analysis:
- On-Balance Volume (OBV): The OBV has been increasing, suggesting accumulation by investors.
- Chaikin Money Flow (CMF): The CMF has been positive but declining, indicating potential profit-taking.
Key Observations:
- The stock has been on an upward trend with strong bullish momentum, as indicated by rising moving averages and MACD.
- However, the overbought RSI and declining Stochastic %K and %D suggest a possible reversal or consolidation in the short term.
- The widening Bollinger Bands reflect increased volatility, which could lead to sharp price movements.
- The positive OBV signals accumulation, but the declining CMF indicates a potential shift in buying pressure.
Conclusion:
Based on the technical indicators analyzed: - Short-Term View: The stock may experience a short-term consolidation or pullback due to overbought conditions and declining momentum indicators. - Medium- to Long-Term View: The overall trend remains bullish, supported by the positive moving averages and MACD.
Recommendation:
- Investors: Consider taking profits on existing positions in the short term and wait for a better entry point during a potential consolidation phase.
- Traders: Look for short-term selling opportunities or wait for clearer signals before entering new positions.
By carefully monitoring the key technical indicators and market dynamics, investors can make informed decisions to navigate potential price movements in GV stock effectively.