Technical Analysis of HAS 2024-05-10
Overview:
In analyzing the technical indicators for HAS over the last 5 days, we will delve into the trend, momentum, volatility, and volume indicators to provide a comprehensive assessment of the stock's potential price movement. By examining these key factors, we aim to offer valuable insights and predictions for the next few days.
Trend Analysis:
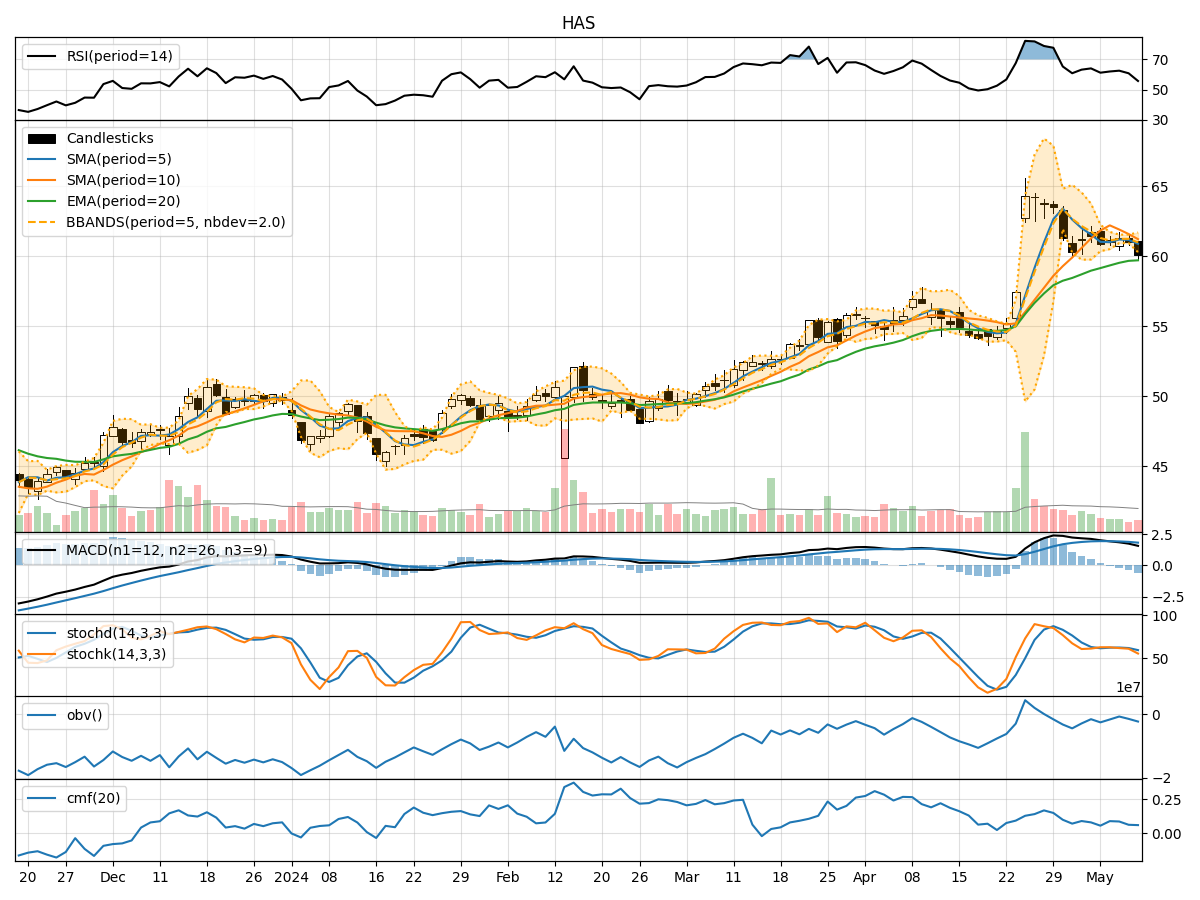
- Moving Averages (MA): The 5-day MA has been fluctuating around the closing prices, indicating short-term price trends. The SMA(10) and EMA(20) show a downward trend, suggesting a bearish sentiment in the medium to long term.
- MACD: The MACD line has been decreasing, with the MACD histogram showing negative values, signaling a bearish trend.
- RSI: The RSI has been declining, indicating weakening buying momentum.
Key Observation: The trend indicators suggest a bearish outlook for HAS in the short to medium term.
Momentum Analysis:
- Stochastic Oscillator: Both %K and %D have been decreasing, indicating a loss in momentum.
- Williams %R: The indicator has been in oversold territory, suggesting a potential reversal.
Key Observation: Momentum indicators point towards a weakening momentum and a possible reversal in the near future.
Volatility Analysis:
- Bollinger Bands (BB): The bands have been narrowing, indicating decreasing volatility.
Key Observation: Volatility has been decreasing, which may lead to a period of consolidation or a breakout.
Volume Analysis:
- On-Balance Volume (OBV): The OBV has been fluctuating, suggesting indecision among market participants.
- Chaikin Money Flow (CMF): The CMF has been positive but relatively flat, indicating a neutral sentiment.
Key Observation: Volume indicators show mixed signals, reflecting uncertainty in market sentiment.
Conclusion:
Based on the analysis of trend, momentum, volatility, and volume indicators, the overall outlook for HAS in the next few days is bearish. The trend indicators, momentum signals, and volume analysis all point towards a potential downward movement in the stock price. However, the decreasing volatility could lead to a period of consolidation before a possible breakout.
Key Conclusion: The stock is likely to experience a downward movement in the coming days, with a possibility of consolidation before a potential breakout. Traders should exercise caution and consider risk management strategies in their trading decisions.