Technical Analysis of HIBB 2024-05-10
Overview:
In analyzing the technical indicators for HIBB over the last 5 days, we will delve into the trend, momentum, volatility, and volume indicators to provide a comprehensive outlook on the possible stock price movement. By examining these key aspects, we aim to offer valuable insights and predictions for the upcoming days.
Trend Indicators:
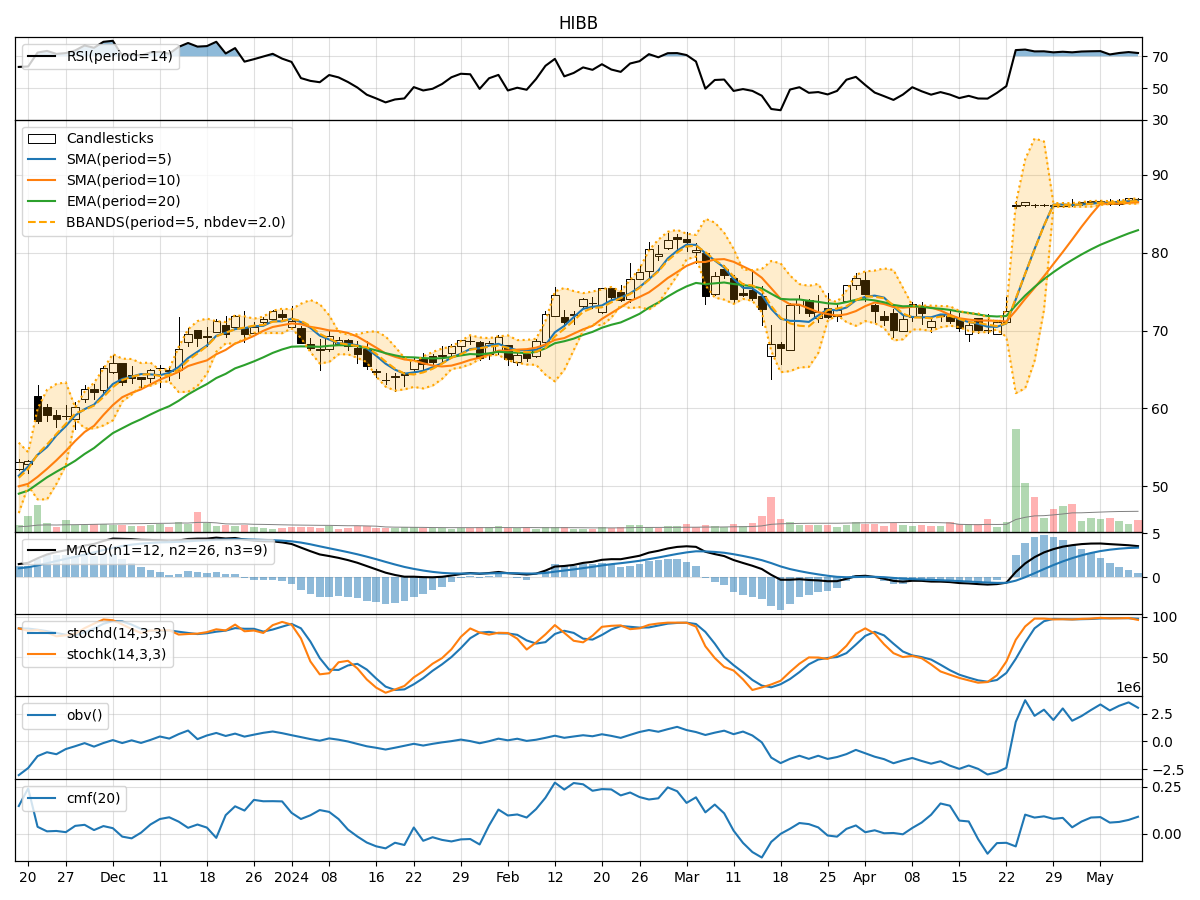
- Moving Averages (MA): The 5-day Moving Average (MA) has been consistently above the Simple Moving Average (SMA) and Exponential Moving Average (EMA), indicating a bullish trend.
- MACD: The MACD line has been above the signal line, with both lines showing an upward trend, suggesting bullish momentum.
- MACD Histogram: The MACD Histogram has been increasing, indicating strengthening bullish momentum.
Momentum Indicators:
- RSI: The Relative Strength Index (RSI) has been in the overbought territory, suggesting a potential reversal or consolidation.
- Stochastic Oscillator: Both %K and %D have been in the overbought zone, signaling a possible pullback.
- Williams %R: The Williams %R is in the oversold region, indicating a potential reversal to the upside.
Volatility Indicators:
- Bollinger Bands: The stock price has been trading within the Bollinger Bands, with the bands widening slightly, indicating increased volatility.
- Bollinger %B: The %B indicator has been fluctuating around the midline, suggesting a balanced market sentiment.
Volume Indicators:
- On-Balance Volume (OBV): The OBV has shown mixed movements, indicating indecision among market participants.
- Chaikin Money Flow (CMF): The CMF has been positive but relatively flat, reflecting a neutral stance on money flow.
Key Observations:
- The trend indicators suggest a strong bullish sentiment, supported by the moving averages and MACD.
- Momentum indicators, particularly RSI and Stochastic Oscillator, point towards a potential reversal or consolidation in the near term.
- Volatility indicators show a slight increase in market volatility, which could lead to more significant price swings.
- Volume indicators indicate mixed participation from investors, with no clear direction in buying or selling pressure.
Conclusion:
Based on the analysis of the technical indicators, the next few days' possible stock price movement for HIBB could see a short-term consolidation or pullback. While the trend remains bullish, the overbought conditions in momentum indicators and the lack of strong volume support suggest a potential pause in the upward momentum. Traders may consider taking profits or waiting for a better entry point before considering long positions. It is essential to monitor key support levels and watch for any signs of a trend reversal before making trading decisions.