Technical Analysis of HIMX 2024-05-10
Overview:
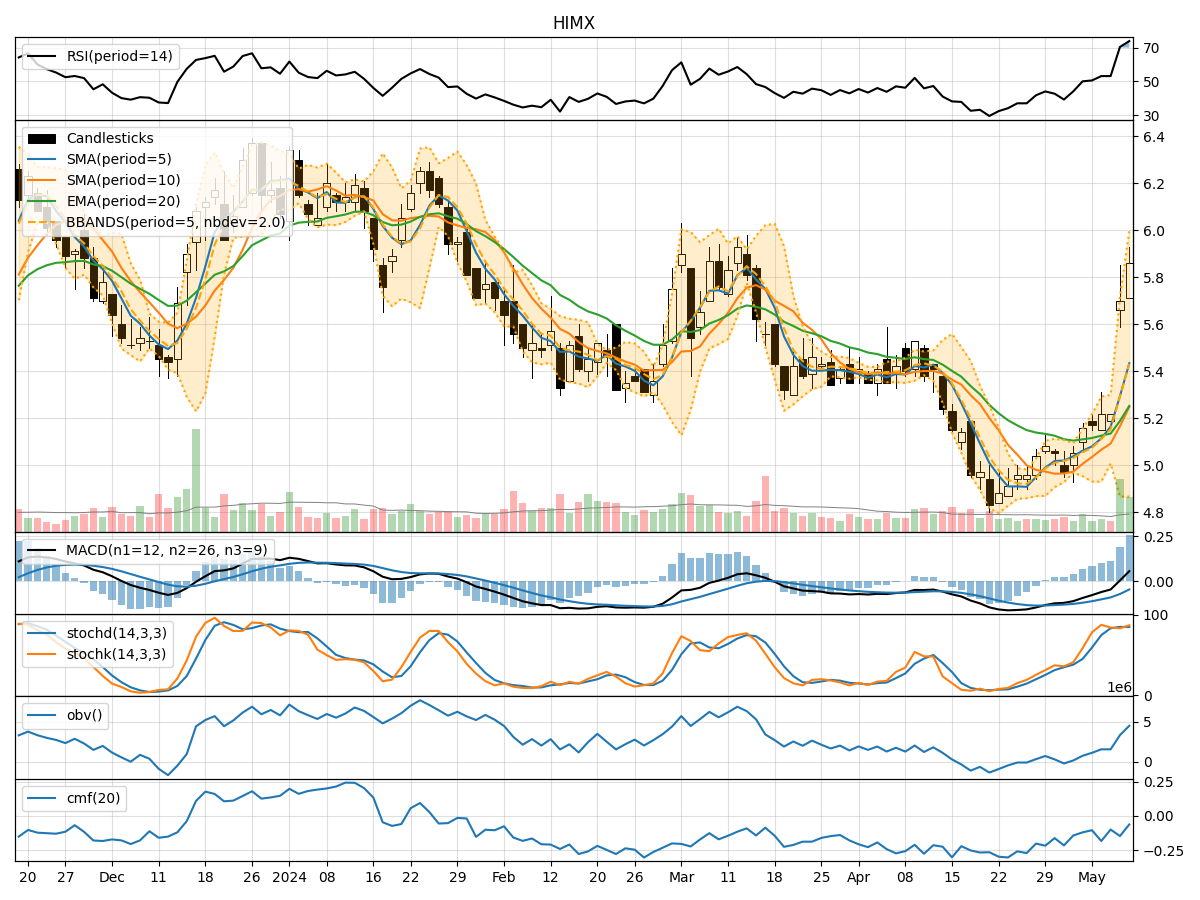
In analyzing the technical indicators for HIMX over the last 5 days, we will delve into the trend, momentum, volatility, and volume indicators to provide a comprehensive outlook on the possible stock price movement. By examining these key aspects, we aim to offer valuable insights and predictions for the upcoming days.
Trend Analysis:
- Moving Averages (MA): The 5-day Moving Average (MA) has been consistently rising, indicating a bullish trend in the short term.
- MACD: The Moving Average Convergence Divergence (MACD) has shown positive values, suggesting a bullish momentum.
- EMA: The Exponential Moving Average (EMA) has been trending upwards, supporting the bullish sentiment.
Momentum Analysis:
- RSI: The Relative Strength Index (RSI) has been increasing, reaching overbought levels, signaling a strong bullish momentum.
- Stochastic Oscillator: Both %K and %D have been in the overbought zone, indicating a potential reversal or consolidation.
- Williams %R: The Williams %R is in the oversold region, suggesting a possible bullish reversal.
Volatility Analysis:
- Bollinger Bands: The Bollinger Bands have widened, indicating increased volatility in the stock price.
- Bollinger %B: The %B indicator is fluctuating, reflecting the volatility in price movements.
Volume Analysis:
- On-Balance Volume (OBV): The OBV has shown positive accumulation, suggesting buying pressure in the stock.
- Chaikin Money Flow (CMF): The CMF has been negative, indicating some selling pressure in the stock.
Key Observations:
- The trend indicators suggest a bullish sentiment in the short term.
- Momentum indicators show a strong bullish momentum but also hint at potential overbought conditions.
- Volatility has increased, indicating potential price swings.
- Volume indicators reflect mixed signals with positive accumulation but negative money flow.
Conclusion:
Based on the analysis of the technical indicators, the stock price of HIMX is likely to experience further upward movement in the next few days. The bullish trend supported by moving averages and MACD, coupled with strong momentum indicated by RSI, suggests a positive outlook. However, caution is advised due to potential overbought conditions highlighted by stochastic oscillators. The increased volatility may lead to price fluctuations, but overall, the bias remains bullish. Investors should closely monitor the price action and consider potential profit-taking opportunities as the stock continues its upward trajectory.