Technical Analysis of HKIT 2024-05-10
Overview:
In analyzing the technical indicators for HKIT over the last 5 days, we will delve into the trend, momentum, volatility, and volume indicators to provide a comprehensive outlook on the possible stock price movement. By examining these key aspects, we aim to offer valuable insights and predictions for the upcoming trading days.
Trend Analysis:
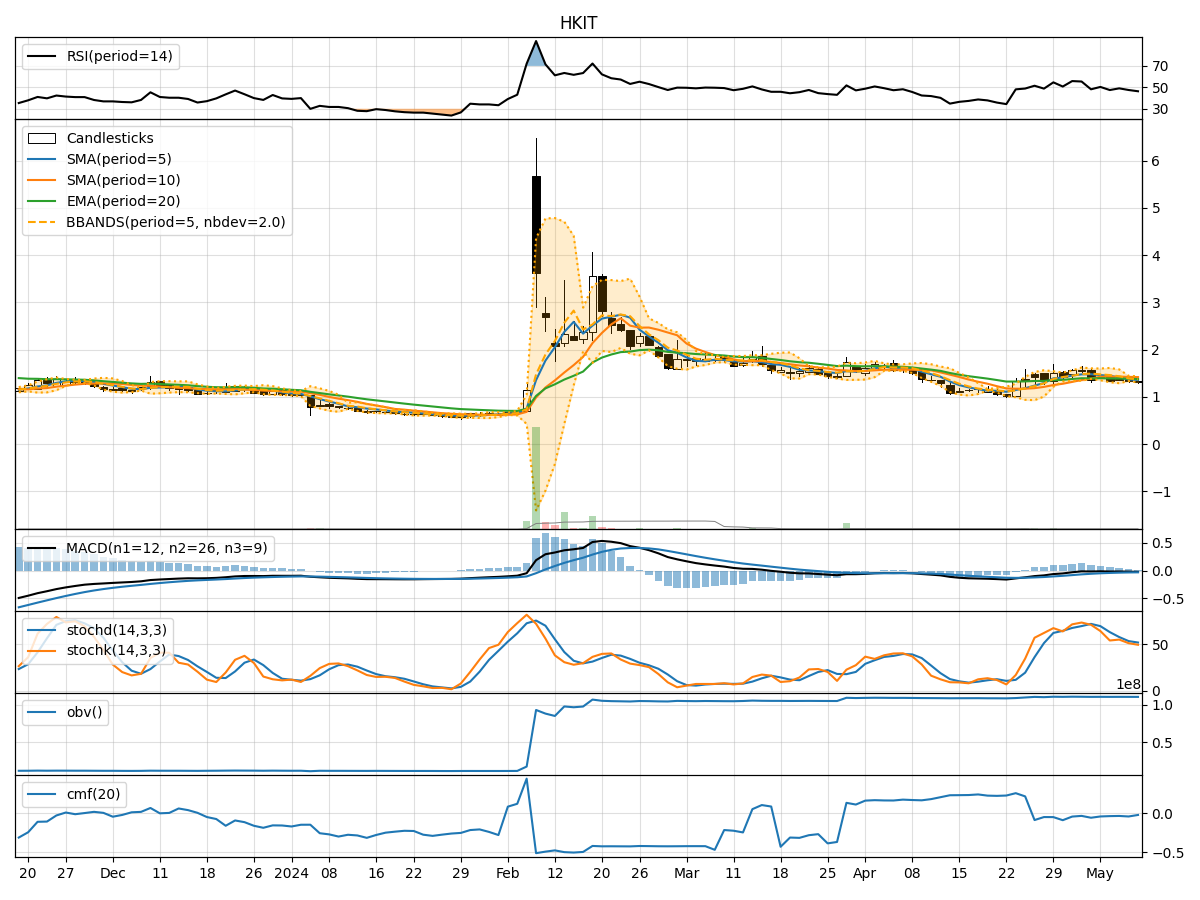
- Moving Averages (MA): The 5-day MA has been consistently below the closing price, indicating a short-term downtrend.
- MACD: The MACD line has been negative, suggesting bearish momentum in the stock.
- EMA: The EMA has been declining, further supporting the bearish trend.
Key Observation: The trend indicators point towards a downward trajectory for HKIT.
Momentum Analysis:
- RSI: The RSI has been hovering around the 50 level, indicating a lack of strong momentum in either direction.
- Stochastic Oscillator: Both %K and %D have been in the oversold territory, signaling potential for a reversal.
- Williams %R: The indicator has been in the oversold region, suggesting a possible bounce back.
Key Observation: Momentum indicators suggest a potential reversal in the near term.
Volatility Analysis:
- Bollinger Bands (BB): The stock price has been trading within the lower Bollinger Band, indicating oversold conditions.
- Bollinger %B: The %B value has been below 0.2, signaling potential undervaluation.
- Average True Range (ATR): Volatility has been relatively low, indicating a lack of significant price movements.
Key Observation: Volatility indicators suggest a potential bounce back or consolidation in the stock price.
Volume Analysis:
- On-Balance Volume (OBV): The OBV has been declining, indicating selling pressure in the stock.
- Chaikin Money Flow (CMF): The CMF has been negative, suggesting outflow of money from the stock.
Key Observation: Volume indicators point towards bearish sentiment in the stock.
Conclusion:
Based on the analysis of trend, momentum, volatility, and volume indicators, the overall outlook for HKIT in the next few days is as follows: - The trend indicators suggest a downward trajectory. - Momentum indicators hint at a potential reversal in the near term. - Volatility indicators indicate a potential bounce back or consolidation. - Volume indicators reflect bearish sentiment in the stock.
Final Verdict:
Considering the mixed signals from the technical indicators, it is advisable to exercise caution in trading HKIT. While there is a possibility of a short-term bounce back or reversal, the overall trend remains bearish. Traders should closely monitor key support and resistance levels for potential entry or exit points. Exercise patience and wait for clearer signals before making significant trading decisions.