Technical Analysis of HLVX 2024-05-10
Overview:
In analyzing the technical indicators for HLVX over the last 5 days, we will delve into the trend, momentum, volatility, and volume indicators to provide a comprehensive outlook on the possible stock price movement in the coming days. By examining these key aspects, we aim to offer valuable insights and predictions for potential investors.
Trend Analysis:
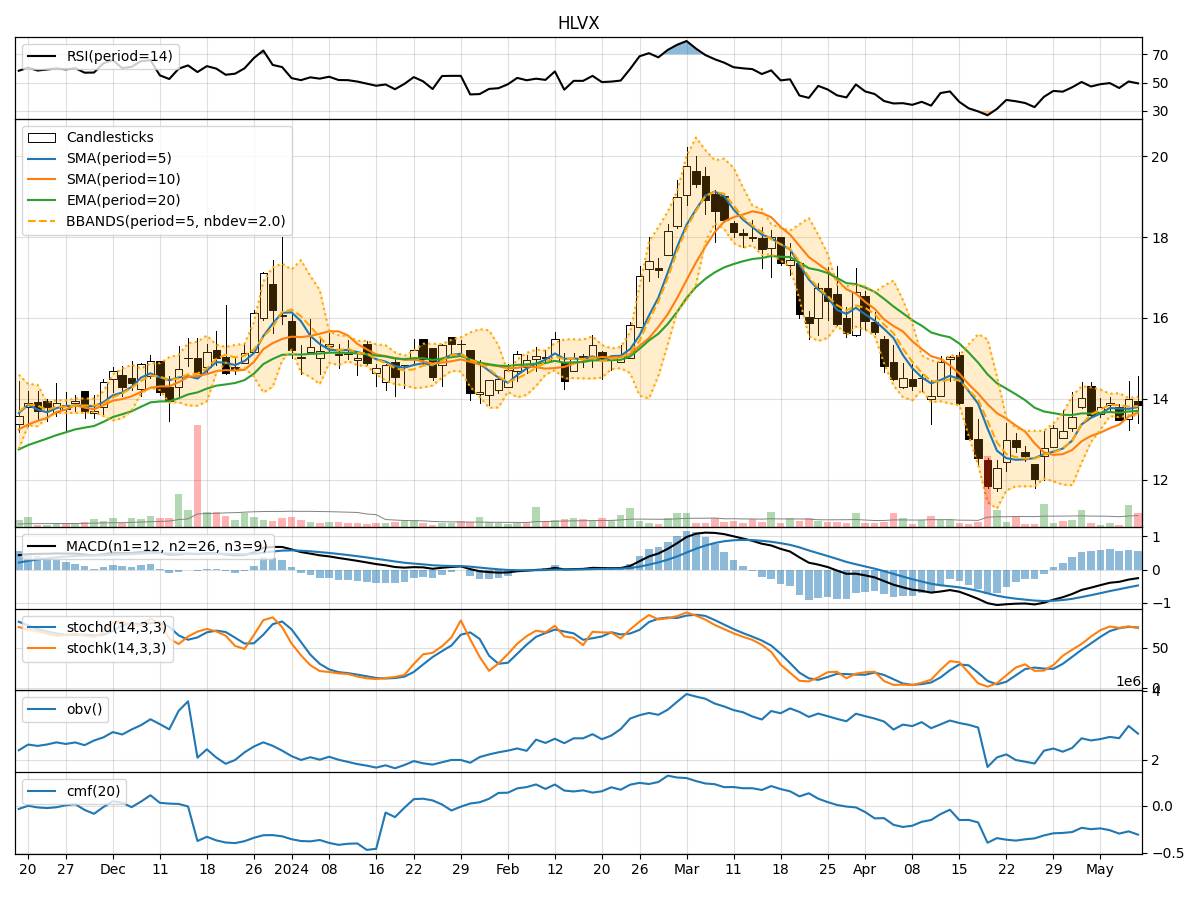
- Moving Averages (MA): The 5-day MA has been fluctuating around the closing prices, indicating short-term price trends. The SMA(10) and EMA(20) have shown a slight upward trend, suggesting a potential bullish sentiment.
- MACD and Signal Line: The MACD has been negative but moving closer to the signal line, indicating a possible trend reversal towards the upside.
- Conclusion: The trend indicators suggest a potential bullish reversal in the stock price movement.
Momentum Analysis:
- RSI: The RSI has been hovering around the neutral zone, indicating a balanced momentum in the stock.
- Stochastic Oscillator: Both %K and %D have been fluctuating, showing indecision in momentum.
- Conclusion: The momentum indicators suggest a sideways movement in the stock price in the near term.
Volatility Analysis:
- Bollinger Bands: The stock price has been trading within the bands, suggesting a stable price movement.
- Conclusion: The volatility indicators imply a consolidation phase in the stock price.
Volume Analysis:
- On-Balance Volume (OBV): The OBV has shown mixed signals, indicating uncertainty in the buying and selling pressure.
- Chaikin Money Flow (CMF): The CMF has been negative, reflecting a lack of strong buying interest.
- Conclusion: The volume indicators suggest a neutral stance in the stock price movement.
Overall Conclusion:
Based on the analysis of trend, momentum, volatility, and volume indicators, the stock price of HLVX is likely to experience sideways movement in the near future. While the trend indicators point towards a potential bullish reversal, the momentum and volume indicators suggest a lack of strong conviction in either direction. The volatility indicators indicate a consolidation phase, further supporting the sideways movement hypothesis.
Recommendation:
Given the mixed signals from the technical indicators, it is advisable for investors to exercise caution and closely monitor the stock price movement. It would be prudent to wait for more clarity in the market dynamics before making any significant investment decisions. Conducting further research and analysis on broader market trends could provide additional insights to make informed investment choices.