Technical Analysis of HNVR 2024-05-31
Overview:
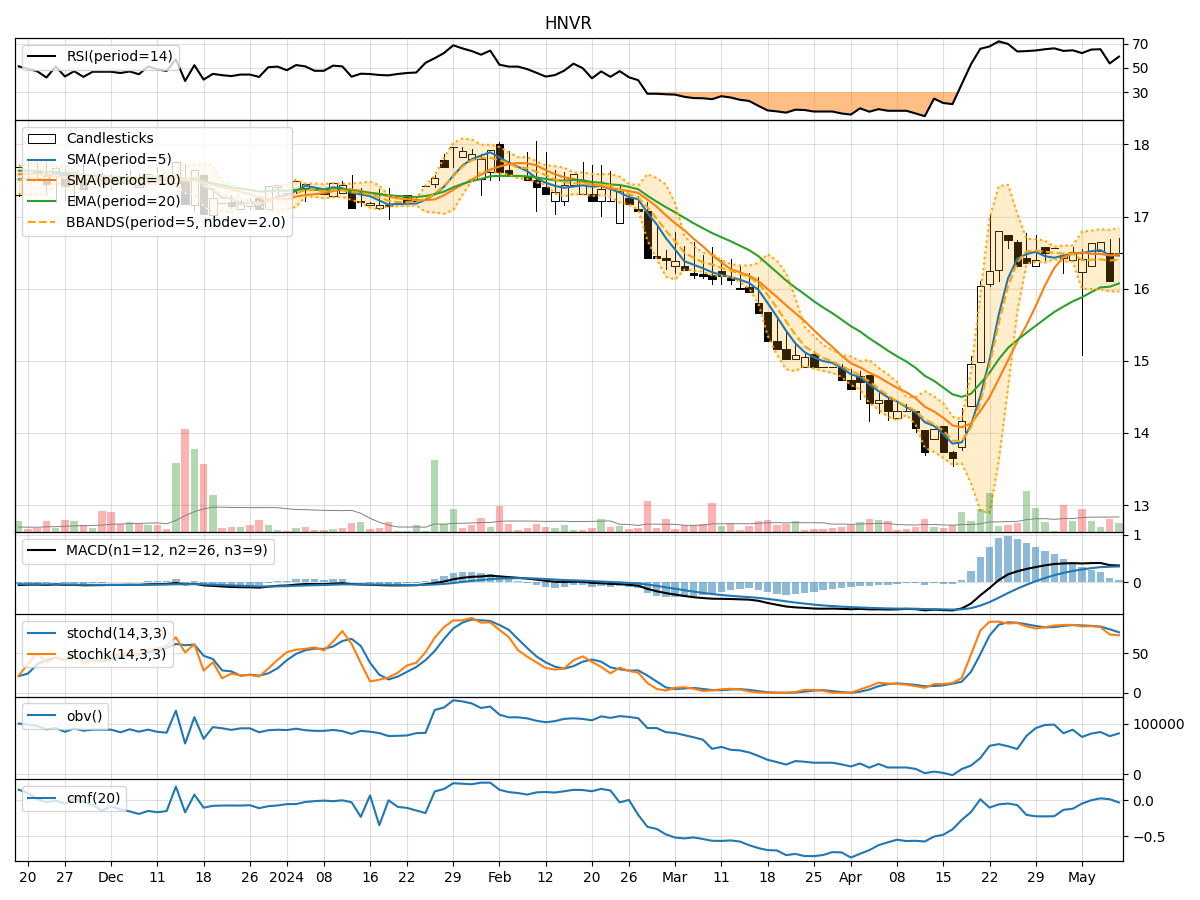
In analyzing the technical indicators for HNVR stock over the last 5 days, we will delve into the trend, momentum, volatility, and volume indicators to provide a comprehensive outlook on the possible stock price movement in the coming days. By examining these key indicators, we aim to offer valuable insights and predictions for potential investors.
Trend Analysis:
- Moving Averages (MA): The 5-day Moving Average (MA) has been relatively stable around the closing prices, indicating a consistent trend.
- MACD: The Moving Average Convergence Divergence (MACD) has shown a slight decrease over the past 5 days, suggesting a potential weakening of the bullish momentum.
- RSI: The Relative Strength Index (RSI) has been fluctuating around the neutral zone, indicating a balanced market sentiment.
Key Observation: The trend indicators suggest a neutral to slightly bearish outlook for HNVR stock in the short term.
Momentum Analysis:
- Stochastic Oscillator: The Stochastic Oscillator has been declining steadily, reaching oversold levels, indicating a potential reversal in momentum.
- Williams %R: The Williams %R indicator has consistently shown oversold conditions, signaling a possible buying opportunity.
Key Observation: Momentum indicators point towards a potential reversal in the downward momentum, hinting at a bullish sentiment in the near future.
Volatility Analysis:
- Bollinger Bands: The Bollinger Bands have been narrowing, indicating decreasing volatility in the stock price.
- Bollinger %B: The Bollinger %B has been hovering around the lower band, suggesting a potential oversold condition.
Key Observation: Volatility indicators signal a period of consolidation or a potential reversal in the stock price movement.
Volume Analysis:
- On-Balance Volume (OBV): The OBV has been negative, indicating a net selling pressure in the stock.
- Chaikin Money Flow (CMF): The CMF has been consistently negative, reflecting a lack of buying interest.
Key Observation: Volume indicators suggest a bearish sentiment prevailing in the market.
Conclusion:
Based on the analysis of trend, momentum, volatility, and volume indicators, the next few days' possible stock price movement for HNVR is likely to experience a short-term consolidation or a minor pullback. While momentum indicators hint at a potential bullish reversal, the overall trend and volume indicators point towards a cautious approach. Investors should closely monitor key support and resistance levels for potential entry or exit points.
Overall View: - Trend: Neutral to slightly bearish - Momentum: Potential bullish reversal - Volatility: Consolidation or reversal - Volume: Bearish sentiment
Recommendation: Exercise caution and wait for confirmation of a clear trend before making significant trading decisions.