Technical Analysis of HOVR 2024-05-10
Overview:
In analyzing the technical indicators for HOVR over the last 5 days, we will delve into the trend, momentum, volatility, and volume indicators to provide a comprehensive outlook on the possible stock price movement. By examining these key aspects, we aim to offer valuable insights and recommendations for potential future price action.
Trend Analysis:
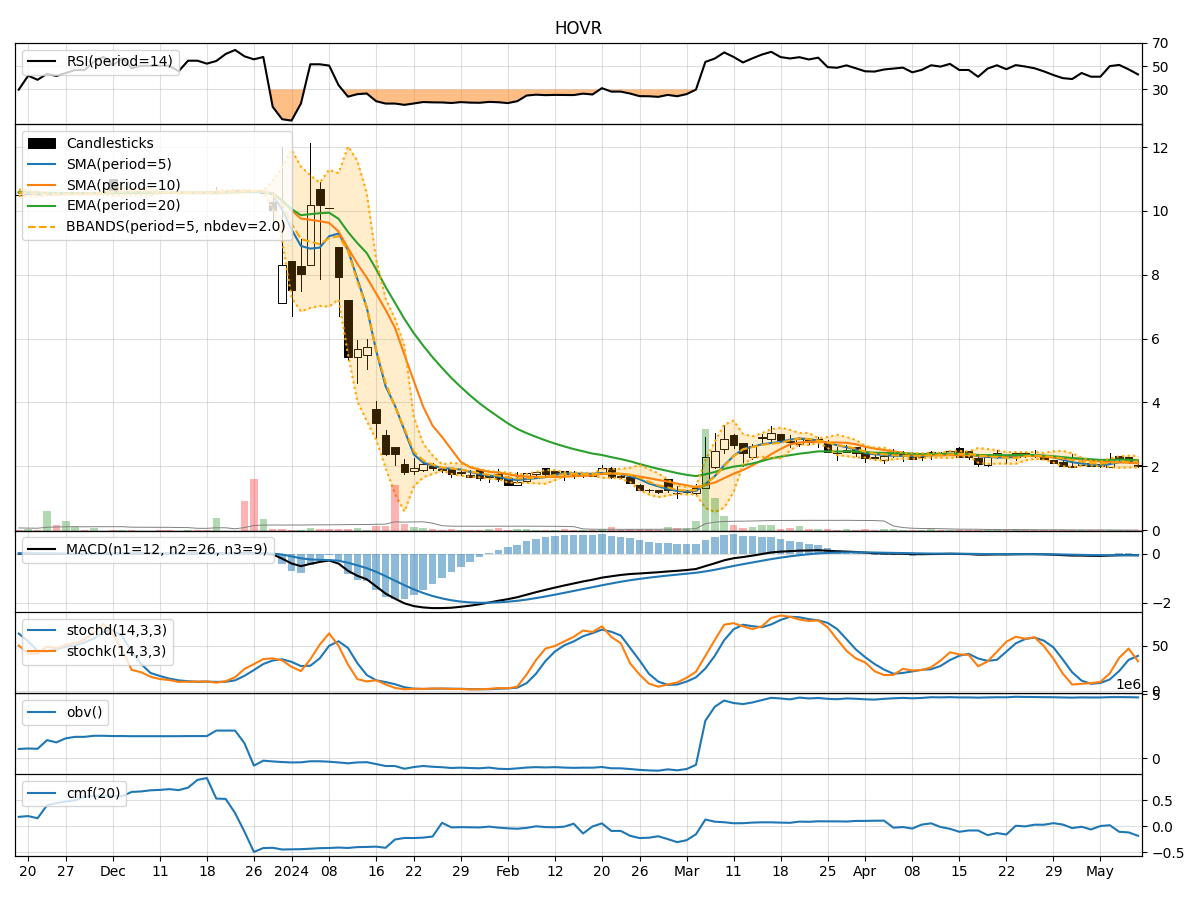
- Moving Averages (MA): The 5-day Moving Average (MA) has been fluctuating around the closing prices, indicating short-term price trends. The Simple Moving Average (SMA) and Exponential Moving Average (EMA) show a slight downward trend, suggesting a bearish sentiment.
- MACD: The Moving Average Convergence Divergence (MACD) has been negative, with the MACD line consistently below the signal line. This indicates a bearish momentum in the stock price.
- Conclusion: The trend indicators suggest a bearish outlook for the stock in the short term.
Momentum Analysis:
- RSI: The Relative Strength Index (RSI) has been hovering around the 50 level, indicating a neutral momentum in the stock price.
- Stochastic Oscillator: Both %K and %D lines of the Stochastic Oscillator have been fluctuating, showing indecision in the momentum.
- Conclusion: The momentum indicators suggest a sideways movement in the stock price in the near future.
Volatility Analysis:
- Bollinger Bands (BB): The Bollinger Bands have been narrowing, indicating decreasing volatility in the stock price.
- Conclusion: The volatility indicators suggest a consolidation phase in the stock price, with a potential breakout in either direction.
Volume Analysis:
- On-Balance Volume (OBV): The OBV has been relatively stable, showing no significant divergence between price and volume movements.
- Chaikin Money Flow (CMF): The CMF has been negative, indicating selling pressure in the stock.
- Conclusion: The volume indicators suggest a bearish sentiment in the stock, with selling pressure outweighing buying interest.
Overall Conclusion:
Based on the analysis of trend, momentum, volatility, and volume indicators, the overall outlook for HOVR in the next few days is bearish with a sideways momentum. The stock is likely to experience continued downward pressure, potentially entering a consolidation phase with decreased volatility. Traders should exercise caution and consider short-term selling strategies or wait for a clear trend reversal signal before considering long positions.
Key Recommendations:
- Short-Term Traders: Consider short-selling opportunities or adopting a wait-and-see approach until a clear trend emerges.
- Long-Term Investors: Monitor the stock closely for a potential trend reversal before considering entry points.
- Risk Management: Implement stop-loss orders to protect against unexpected price movements and manage risk effectively.
By combining insights from various technical indicators, traders and investors can make informed decisions aligned with the prevailing market dynamics.