Technical Analysis of HUGE 2024-05-10
Overview:
In analyzing the technical indicators for the stock over the last 5 days, we will delve into the trend, momentum, volatility, and volume indicators to provide a comprehensive outlook on the possible stock price movement in the coming days.
Trend Analysis:
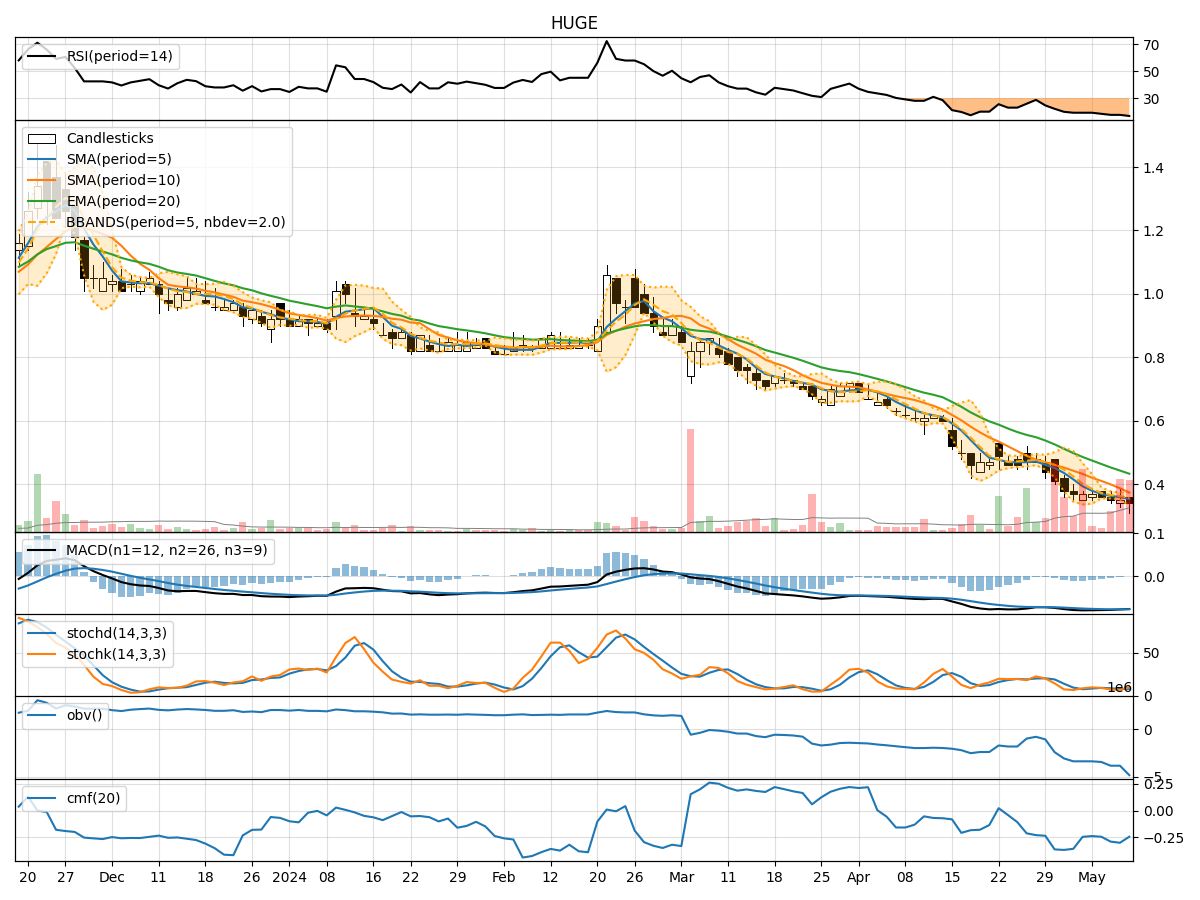
- Moving Averages (MA): The 5-day MA has been consistently decreasing, indicating a downward trend in the stock price.
- MACD: The MACD line has been negative and decreasing, suggesting bearish momentum in the stock.
- EMA: The EMA has also been declining, further supporting the bearish trend in the stock.
Momentum Analysis:
- RSI: The RSI has been decreasing, indicating weakening momentum in the stock.
- Stochastic Oscillator: Both %K and %D have been trending downwards, signaling a bearish momentum.
- Williams %R: The indicator has been in oversold territory, suggesting a potential reversal or continuation of the downtrend.
Volatility Analysis:
- Bollinger Bands (BB): The stock price has been consistently below the lower Bollinger Band, indicating oversold conditions.
- Bollinger %B: The %B has been below 0.2, suggesting the stock is oversold.
- Bollinger Band Width: The Band Width has been narrowing, indicating decreasing volatility.
Volume Analysis:
- On-Balance Volume (OBV): The OBV has been consistently negative, reflecting selling pressure in the stock.
- Chaikin Money Flow (CMF): The CMF has been negative, indicating outflow of money from the stock.
Key Observations:
- The stock is currently in a strong bearish trend based on the moving averages, MACD, and EMA indicators.
- Momentum indicators such as RSI and Stochastic Oscillator support the bearish sentiment in the stock.
- Volatility indicators suggest that the stock is oversold and experiencing low volatility.
- Volume indicators reflect selling pressure and a negative money flow in the stock.
Conclusion:
Based on the analysis of the technical indicators, the stock is likely to continue its downward movement in the coming days. The bearish trend, supported by momentum, volatility, and volume indicators, indicates a high probability of further price decline. Investors should exercise caution and consider waiting for signs of a potential reversal before considering any long positions.