Technical Analysis of HYW 2024-05-10
Overview:
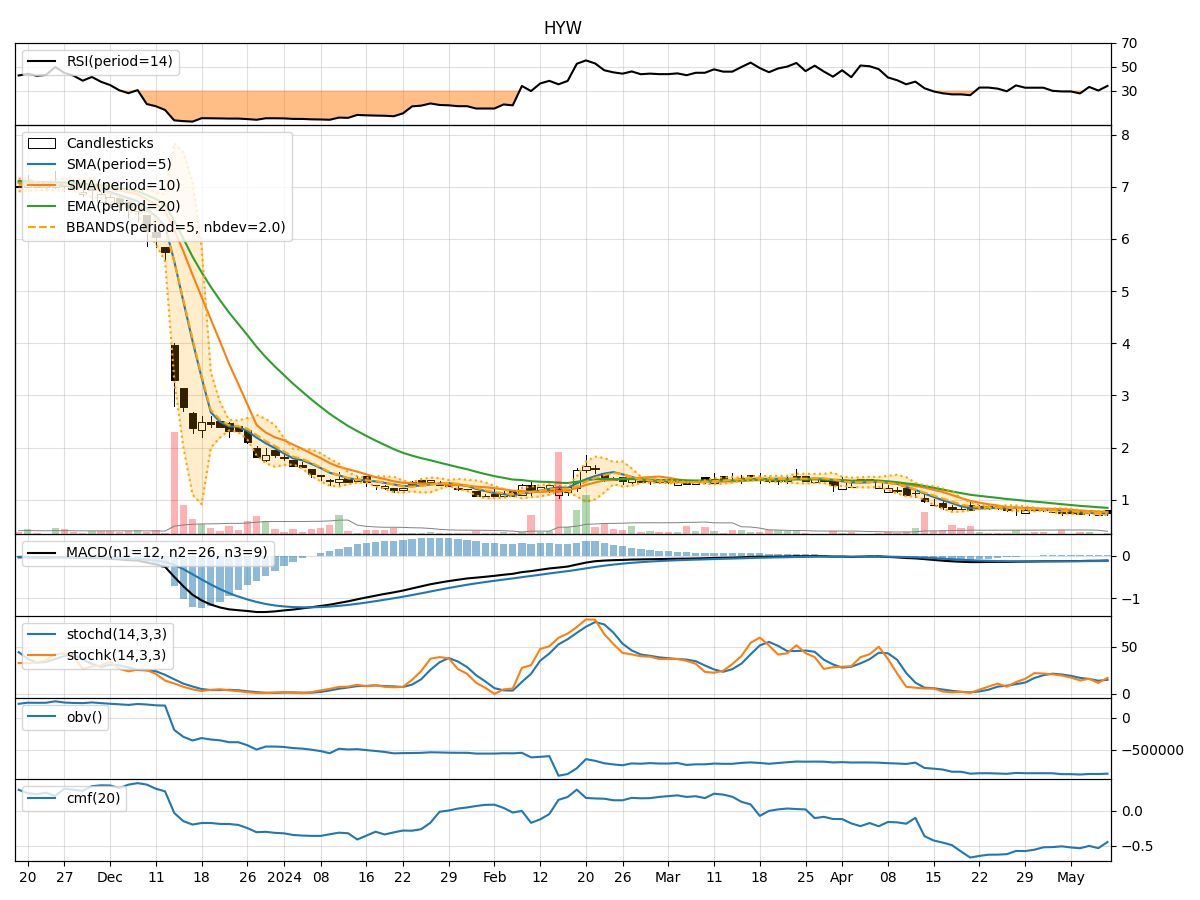
In analyzing the technical indicators for HYW over the last 5 days, we will delve into the trend, momentum, volatility, and volume indicators to provide a comprehensive outlook on the possible stock price movement. By examining these key factors, we aim to offer valuable insights and predictions for the upcoming days.
Trend Analysis:
- Moving Averages (MA): The 5-day MA has been consistently below the closing price, indicating a downward trend.
- MACD: The MACD line has been negative, suggesting bearish momentum in the stock.
- EMA: The EMA has been declining, further supporting the bearish trend.
Key Observation: The trend indicators point towards a bearish outlook for HYW.
Momentum Analysis:
- RSI: The RSI values have been relatively low, indicating oversold conditions.
- Stochastic Oscillator: Both %K and %D have been in the oversold territory.
- Williams %R: The indicator has been consistently showing oversold conditions.
Key Observation: Momentum indicators suggest that the stock is oversold and may see a potential reversal in the near future.
Volatility Analysis:
- Bollinger Bands: The stock price has been trading within the lower Bollinger Band, indicating a period of low volatility.
- Bollinger %B: The %B values have been below 0.2, signaling an oversold condition.
Key Observation: Volatility indicators suggest that the stock is currently in a low volatility phase.
Volume Analysis:
- On-Balance Volume (OBV): The OBV has been declining, indicating selling pressure in the stock.
- Chaikin Money Flow (CMF): The CMF has been negative, reflecting a lack of buying interest.
Key Observation: Volume indicators point towards bearish sentiment in the stock.
Conclusion:
Based on the analysis of trend, momentum, volatility, and volume indicators, the overall outlook for HYW in the next few days is bearish. The stock is currently in an oversold condition, but the trend and volume indicators suggest a continuation of the downward movement. Traders and investors should exercise caution and consider waiting for a more favorable entry point before considering any long positions.
Key Conclusion:
The next few days for HYW are likely to see further downward movement based on the technical indicators analyzed. It is advisable to monitor the stock closely for any signs of a potential reversal before considering any bullish positions.