Technical Analysis of IART 2024-05-10
Overview:
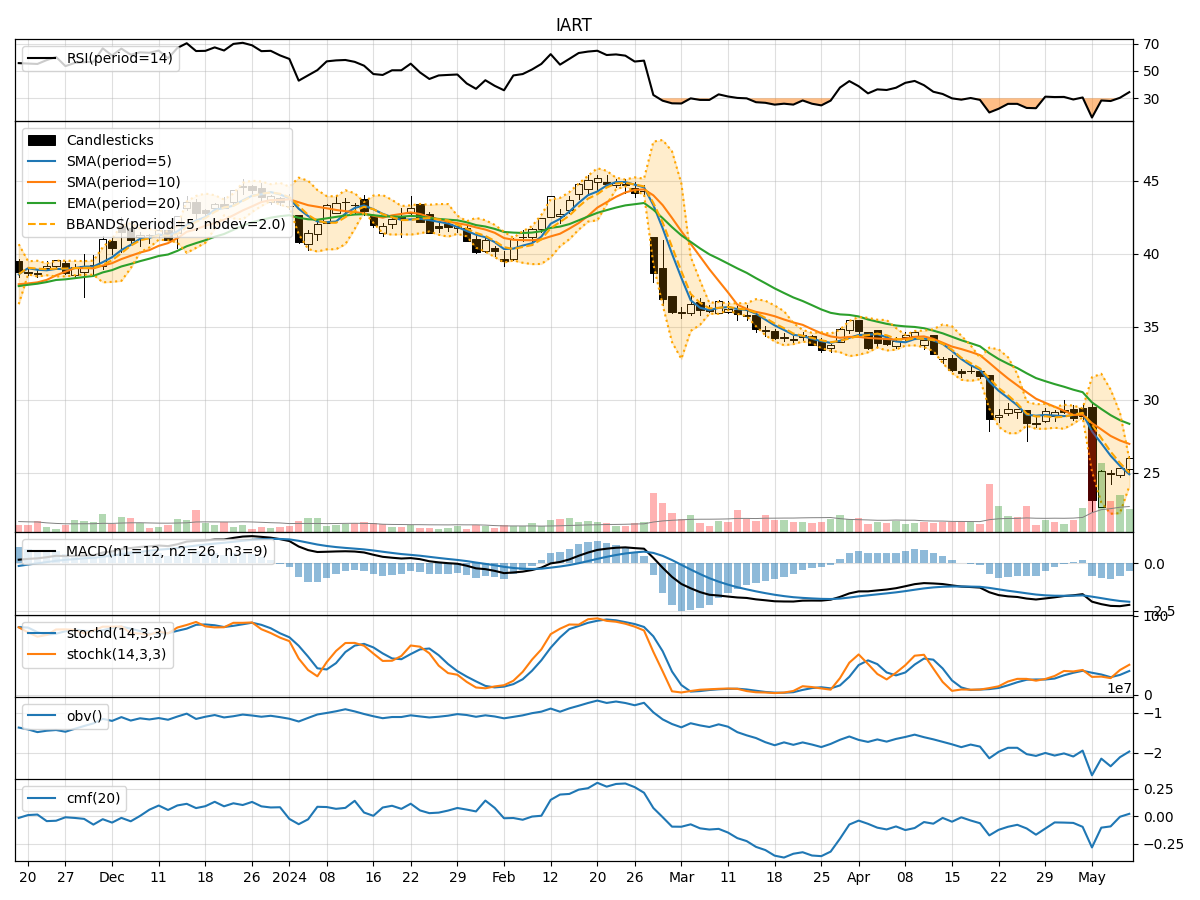
In analyzing the technical indicators for IART over the last 5 days, we will delve into the trends, momentum, volatility, and volume indicators to provide a comprehensive outlook on the possible stock price movement in the coming days. By examining these key aspects, we aim to offer valuable insights and predictions for informed decision-making.
Trend Analysis:
- Moving Averages (MA): The 5-day MA has been consistently below the longer-term SMAs and EMAs, indicating a downward trend.
- MACD: The MACD line has been below the signal line, with negative values, suggesting bearish momentum.
Momentum Analysis:
- RSI: The RSI values have been relatively low, indicating oversold conditions.
- Stochastic Oscillator: Both %K and %D have been trending upwards but remain below the overbought threshold, suggesting potential for further upside.
Volatility Analysis:
- Bollinger Bands (BB): The stock price has been consistently below the middle BB, indicating a downtrend with lower volatility.
Volume Analysis:
- On-Balance Volume (OBV): The OBV has been decreasing, reflecting selling pressure.
- Chaikin Money Flow (CMF): The CMF has been negative, indicating outflows from the stock.
Key Observations:
- The stock is currently in a downtrend based on moving averages and MACD.
- Momentum indicators suggest a potential for a rebound as RSI is in oversold territory and stochastic indicators are showing signs of upward momentum.
- Volatility is decreasing, indicating a more stable price movement.
- Volume indicators reflect selling pressure as OBV is declining and CMF is negative.
Conclusion:
Based on the analysis of technical indicators, the next few days' possible stock price movement for IART is likely to see a short-term rebound or consolidation. While the trend remains bearish, the momentum indicators suggest a potential for a temporary upside movement. Traders should closely monitor the RSI and stochastic indicators for confirmation of a reversal. However, the overall outlook remains cautious due to the prevailing downtrend and selling pressure indicated by volume indicators.