Technical Analysis of ICLK 2024-05-10
Overview:
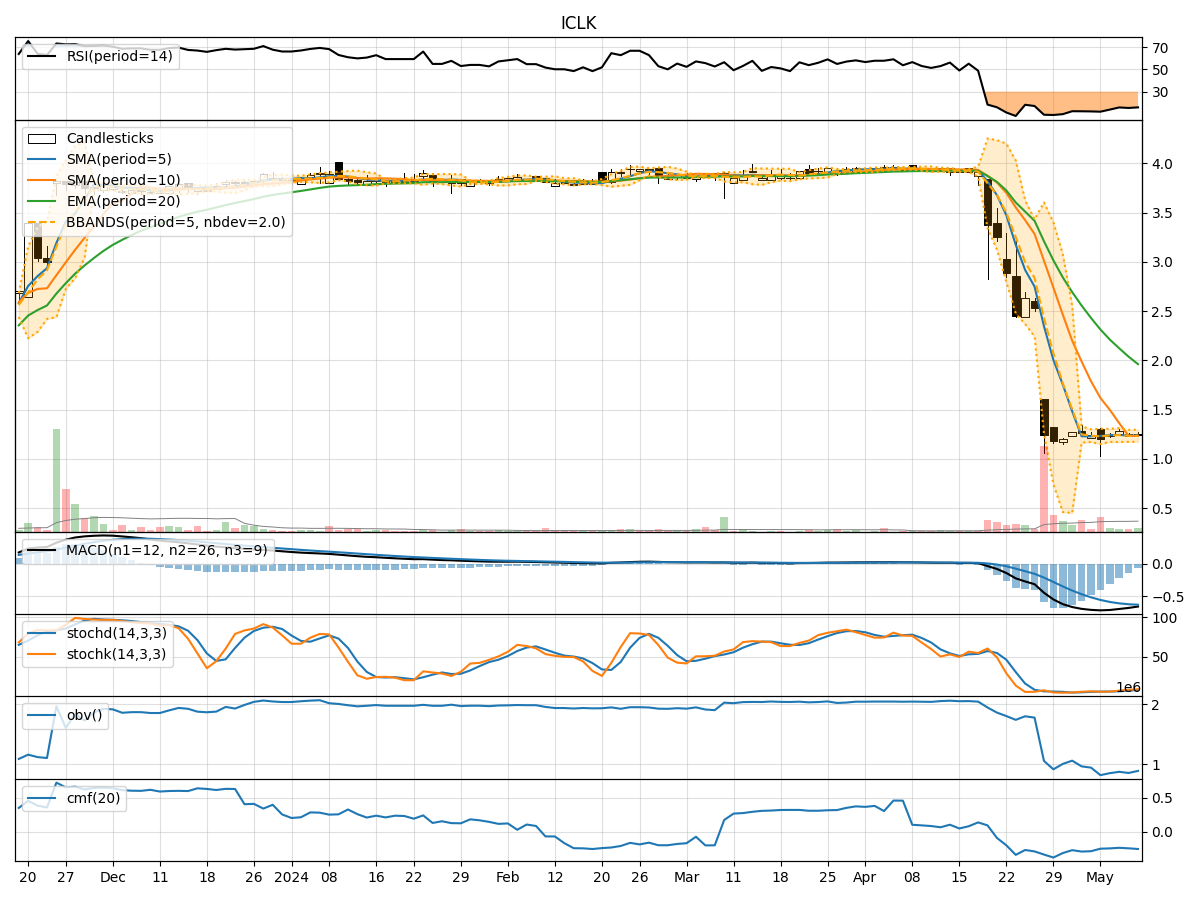
In analyzing the technical indicators for ICLK over the last 5 days, we will delve into the trend, momentum, volatility, and volume indicators to provide a comprehensive outlook on the possible stock price movement. By examining these key aspects, we aim to offer valuable insights and predictions for the upcoming days.
Trend Analysis:
- Moving Averages (MA): The 5-day Moving Average (MA) has been gradually decreasing from 1.234 to 1.238, indicating a short-term downtrend.
- MACD: The Moving Average Convergence Divergence (MACD) has been consistently negative, with the MACD line below the signal line, suggesting bearish momentum.
- EMA: The Exponential Moving Average (EMA) has also been declining, reinforcing the bearish trend.
Momentum Analysis:
- RSI: The Relative Strength Index (RSI) has shown a slight increase but remains at low levels around 15, indicating oversold conditions.
- Stochastic Oscillator: Both %K and %D lines of the Stochastic Oscillator have been rising, but they are still in the oversold territory.
- Williams %R: The Williams %R is also in the oversold region, suggesting a potential reversal.
Volatility Analysis:
- Bollinger Bands: The Bollinger Bands have narrowed, indicating decreased volatility in the stock price.
- Bollinger %B: The %B indicator is below 1, suggesting the stock is trading below the lower Bollinger Band, potentially indicating an oversold condition.
Volume Analysis:
- On-Balance Volume (OBV): The OBV has been declining over the past 5 days, indicating selling pressure in the stock.
- Chaikin Money Flow (CMF): The CMF is negative, reflecting outflow of money from the stock.
Key Observations and Opinions:
- The trend indicators, momentum oscillators, and volume indicators all point towards a bearish sentiment in the stock.
- The stock is currently oversold based on the RSI, Stochastic, and Williams %R indicators.
- Volatility has decreased, potentially signaling a period of consolidation or a pause in the downtrend.
Conclusion:
Based on the analysis of the technical indicators, the next few days for ICLK are likely to see further downward movement in the stock price. The bearish trend, coupled with oversold conditions and negative volume flow, suggests that investors may continue to sell off the stock. Traders should exercise caution and consider waiting for signs of a reversal before considering any long positions.