Technical Analysis of ICLR 2024-05-10
Overview:
In analyzing the technical indicators for ICLR over the last 5 days, we will delve into the trend, momentum, volatility, and volume indicators to provide a comprehensive outlook on the possible stock price movement. By examining these key factors, we aim to offer valuable insights and predictions for the upcoming days.
Trend Indicators:
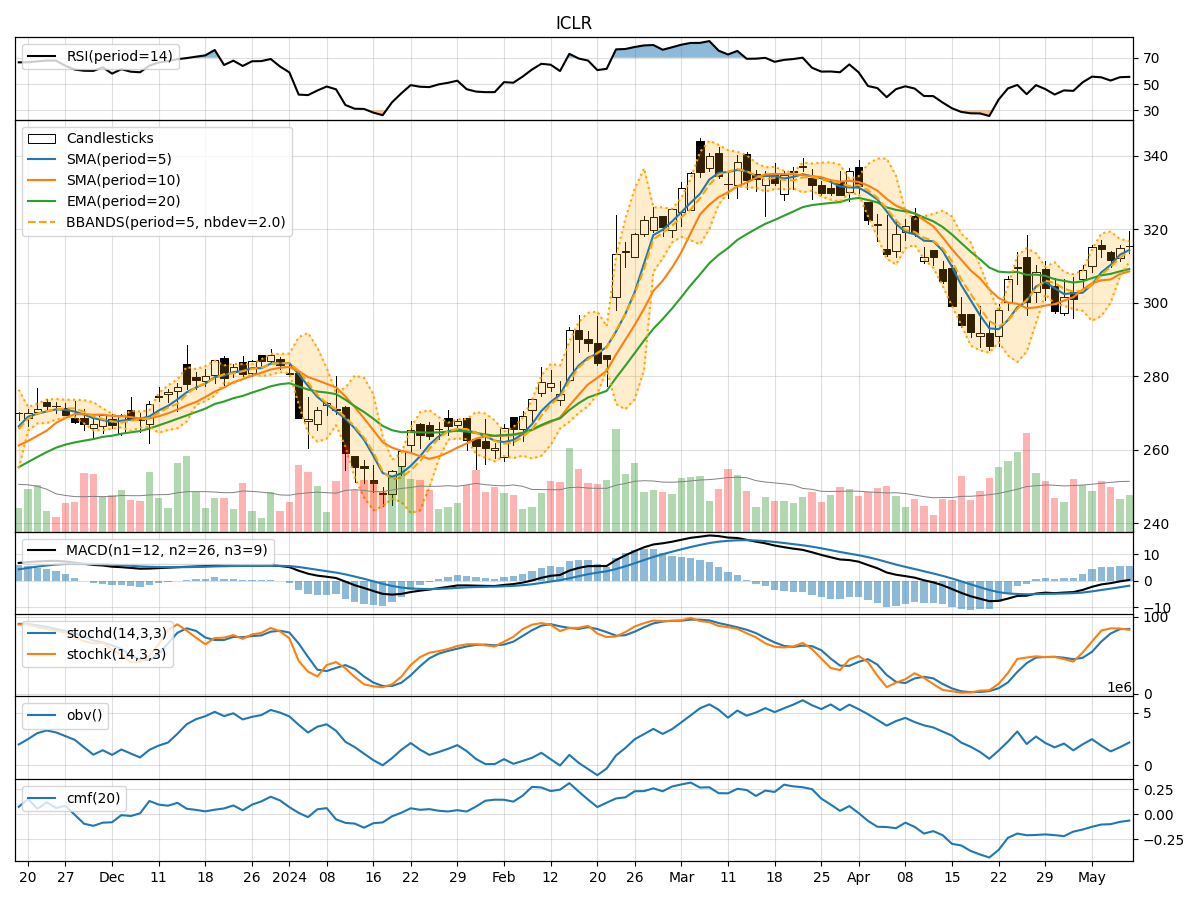
- Moving Averages (MA): The moving averages show an increasing trend over the last 5 days, with the 5-day MA consistently above the longer-term SMAs and EMAs. This indicates a bullish trend in the short to medium term.
- MACD: The MACD line has been consistently above the signal line, with both lines showing an upward trajectory. This suggests strong bullish momentum in the stock.
- MACD Histogram: The MACD histogram has been consistently positive, indicating an increasing bullish momentum.
Momentum Indicators:
- RSI: The RSI has been hovering around the 50 level, indicating a neutral stance in terms of momentum.
- Stochastic Oscillator: Both %K and %D lines of the Stochastic Oscillator have been in the overbought zone, suggesting a potential reversal or consolidation in the near future.
- Williams %R: The Williams %R is in the oversold territory, indicating a potential buying opportunity.
Volatility Indicators:
- Bollinger Bands: The Bollinger Bands have been narrowing, indicating decreasing volatility in the stock price. This could precede a period of consolidation or a breakout in either direction.
- Bollinger %B: The %B indicator is close to 1, suggesting that the stock price is trading near the upper band, potentially signaling an overbought condition.
Volume Indicators:
- On-Balance Volume (OBV): The OBV has been fluctuating, indicating mixed buying and selling pressure in the stock.
- Chaikin Money Flow (CMF): The CMF has been negative, suggesting that money may be flowing out of the stock.
Conclusion:
Based on the analysis of the technical indicators, the stock of ICLR is currently exhibiting a bullish trend with strong momentum indicated by the MACD. However, the Stochastic Oscillator being in the overbought zone and the narrowing Bollinger Bands suggest a potential consolidation or pullback in the near future. The RSI being neutral further supports the view of a possible sideways movement.
Considering the mixed signals from the volume indicators, it is essential to monitor the price action closely for any signs of a reversal or continuation of the current trend. Traders and investors should exercise caution and wait for clearer signals before making significant trading decisions.
In conclusion, while the overall trend is bullish, the stock may experience a period of consolidation or a minor correction before potentially resuming its upward trajectory. It is advisable to wait for confirmation from key indicators before taking any significant trading positions.