Technical Analysis of ICUI 2024-05-10
Overview:
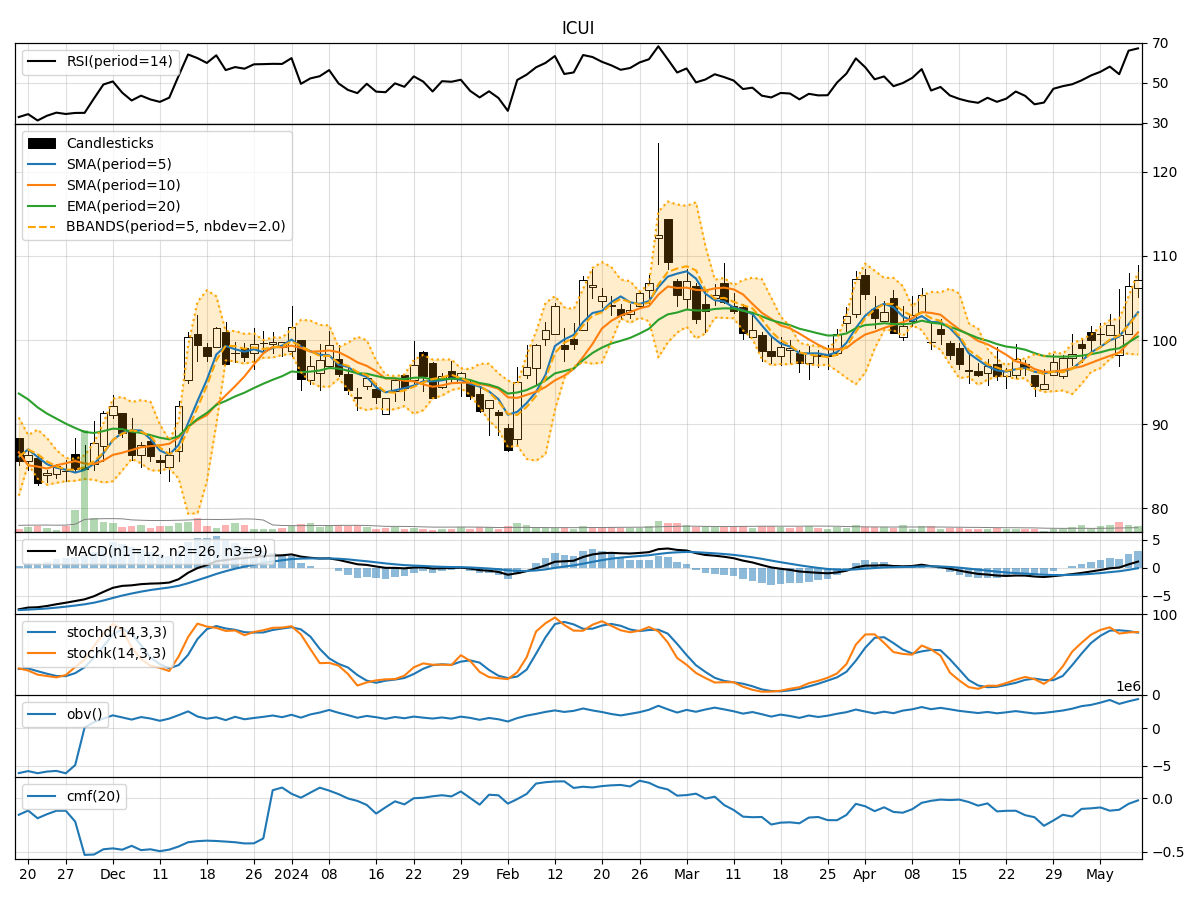
In analyzing the technical indicators for ICUI over the last 5 days, we will delve into the trend, momentum, volatility, and volume indicators to provide a comprehensive outlook on the possible stock price movement in the coming days.
Trend Analysis:
- Moving Averages (MA): The 5-day Moving Average has been consistently rising, indicating a bullish trend.
- MACD: The MACD line has been above the signal line for the past few days, suggesting a bullish momentum.
- RSI: The Relative Strength Index has been fluctuating but generally staying within the neutral range, indicating a balanced market sentiment.
Momentum Analysis:
- Stochastic Oscillator: Both %K and %D have been fluctuating but are currently in the overbought zone, signaling a potential reversal.
- Williams %R: The indicator has been hovering around oversold levels, suggesting a possible buying opportunity.
Volatility Analysis:
- Bollinger Bands: The stock price has been consistently trading above the middle Bollinger Band, indicating an uptrend.
- Bollinger %B: The %B indicator has been fluctuating but is currently below 1, suggesting a potential buying opportunity.
Volume Analysis:
- On-Balance Volume (OBV): The OBV has been increasing, indicating accumulation by investors.
- Chaikin Money Flow (CMF): The CMF has been negative, suggesting some selling pressure in the stock.
Key Observations:
- The trend indicators suggest a bullish sentiment with moving averages and MACD signaling upward momentum.
- Momentum indicators show mixed signals with stochastic oscillators indicating a potential reversal and Williams %R pointing to a buying opportunity.
- Volatility indicators indicate an uptrend with the stock price consistently above the middle Bollinger Band.
- Volume indicators show accumulation based on OBV but some selling pressure based on CMF.
Conclusion:
Based on the analysis of the technical indicators, the stock price of ICUI is likely to continue its upward movement in the next few days. The bullish trend supported by moving averages and MACD, along with the potential buying opportunities indicated by momentum indicators, suggests a positive outlook. Despite some selling pressure indicated by CMF, the overall trend and momentum signals outweigh this factor, pointing towards a bullish view for ICUI in the near term. Investors may consider taking advantage of potential buying opportunities highlighted by momentum indicators while monitoring for any signs of trend reversal.