Technical Analysis of IDXX 2024-05-10
Overview:
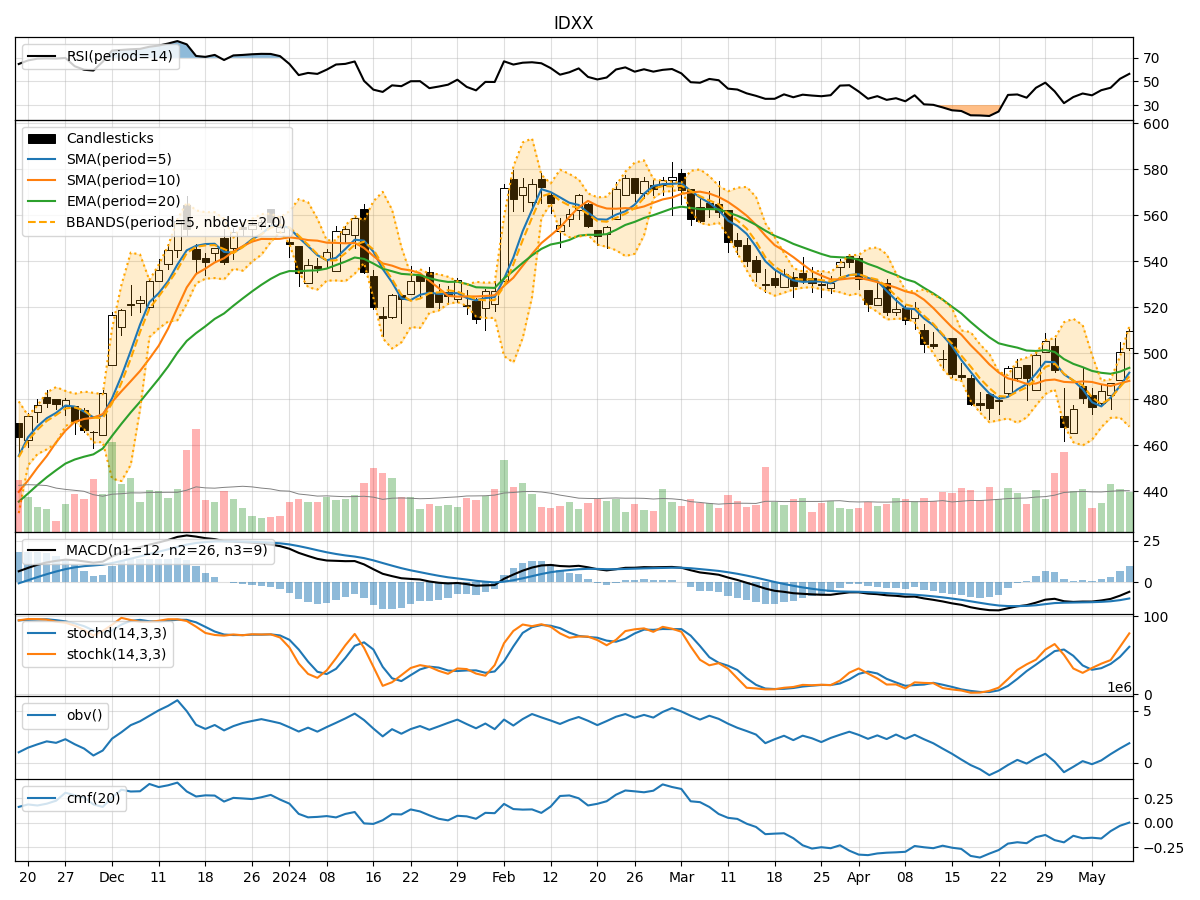
In analyzing the technical indicators for IDXX over the last 5 days, we will delve into the trend, momentum, volatility, and volume indicators to provide a comprehensive outlook on the possible stock price movement in the coming days. By examining these key indicators, we aim to offer valuable insights and predictions to guide your investment decisions.
Trend Indicators:
- Moving Averages (MA): The 5-day MA has been showing a slight decline, indicating short-term bearish sentiment. However, the stock price remains above the 10-day SMA and 20-day EMA, suggesting a potential reversal.
- MACD: The MACD line has been decreasing, but the MACD histogram is showing signs of convergence, hinting at a possible trend reversal.
- Conclusion: The trend indicators suggest a short-term bearish outlook with a potential for a reversal in the near future.
Momentum Indicators:
- RSI: The RSI has been gradually increasing, indicating strengthening momentum in the stock price.
- Stochastic Oscillator: Both %K and %D lines of the Stochastic Oscillator are in the overbought zone, suggesting a potential pullback.
- Conclusion: Momentum indicators point towards a short-term overbought condition, signaling a possible correction or consolidation.
Volatility Indicators:
- Bollinger Bands: The stock price has been consistently trading above the upper Bollinger Band, indicating overbought conditions and potential for a reversal.
- Conclusion: Volatility indicators suggest an overextended price movement, signaling a likely pullback or consolidation in the near term.
Volume Indicators:
- On-Balance Volume (OBV): The OBV has been declining, indicating selling pressure in the stock.
- Chaikin Money Flow (CMF): The CMF has been negative, reflecting a lack of buying interest.
- Conclusion: Volume indicators point towards a bearish sentiment with more selling pressure than buying interest.
Overall Conclusion:
Based on the analysis of trend, momentum, volatility, and volume indicators, the stock price of IDXX is likely to experience a short-term correction or consolidation. The trend indicators suggest a bearish outlook with a potential for reversal, while momentum and volume indicators indicate overbought conditions and selling pressure. Volatility indicators also point towards a possible pullback in the stock price.
Recommendation:
Considering the overall analysis, it is advisable to exercise caution in trading IDXX in the coming days. Traders may consider taking profits or implementing risk management strategies to navigate the potential correction or consolidation phase. Long-term investors could use this opportunity to accumulate the stock at lower levels once the correction is complete.
Disclaimer:
This analysis is based solely on technical indicators and historical data, and it is important to consider other fundamental factors and market dynamics before making any investment decisions. Market conditions can change rapidly, so it is crucial to stay informed and adapt your strategies accordingly.