Technical Analysis of IINN 2024-05-10
Overview:
In analyzing the technical indicators for IINN over the last 5 days, we will delve into the trend, momentum, volatility, and volume indicators to provide a comprehensive outlook on the possible stock price movement in the coming days. By examining these key aspects, we aim to offer valuable insights and predictions to guide your investment decisions.
Trend Analysis:
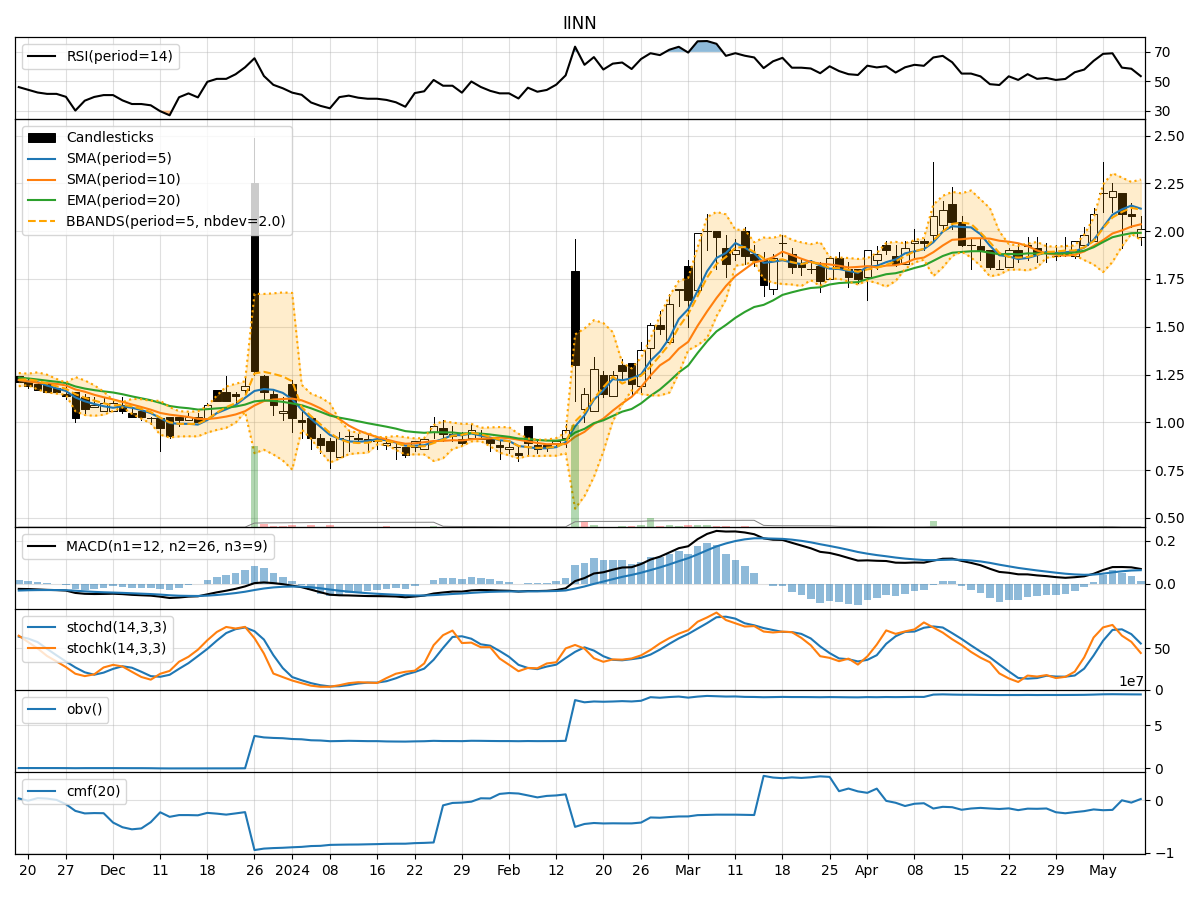
- Moving Averages (MA): The 5-day MA has been consistently above the closing prices, indicating a short-term uptrend.
- MACD: The MACD line has been positive, suggesting bullish momentum in the stock.
- EMA: The EMA has been trending upwards, supporting the bullish sentiment in the short to medium term.
Key Observation: The trend indicators point towards a bullish outlook for IINN.
Momentum Analysis:
- RSI: The RSI has been fluctuating but generally staying above the 50 level, indicating bullish momentum.
- Stochastic Oscillator: Both %K and %D have been declining, suggesting a potential reversal in momentum.
- Williams %R: The indicator has been in oversold territory, signaling a possible upcoming bullish reversal.
Key Observation: Momentum indicators show mixed signals, with a slight bias towards a bullish reversal.
Volatility Analysis:
- Bollinger Bands: The stock price has been trading within the bands, indicating normal volatility.
- Bollinger %B: The %B has been fluctuating around the midline, suggesting a balanced market sentiment.
Key Observation: Volatility indicators suggest a stable market environment with no extreme price movements expected.
Volume Analysis:
- On-Balance Volume (OBV): The OBV has been declining, indicating selling pressure in the stock.
- Chaikin Money Flow (CMF): The CMF has been negative, reflecting a bearish money flow trend.
Key Observation: Volume indicators point towards a bearish sentiment in the market.
Conclusion:
Based on the analysis of trend, momentum, volatility, and volume indicators, the overall outlook for IINN in the next few days leans towards a sideways to slightly bearish movement. While the trend indicators suggest a bullish sentiment, the momentum indicators show mixed signals with a potential bullish reversal. However, the volume indicators indicate selling pressure and a bearish money flow trend, which could weigh on the stock price.
Key Conclusion: Considering the conflicting signals from the indicators, it is advisable to exercise caution and closely monitor the stock's price action in the coming days.