Technical Analysis of IMCR 2024-05-10
Overview:
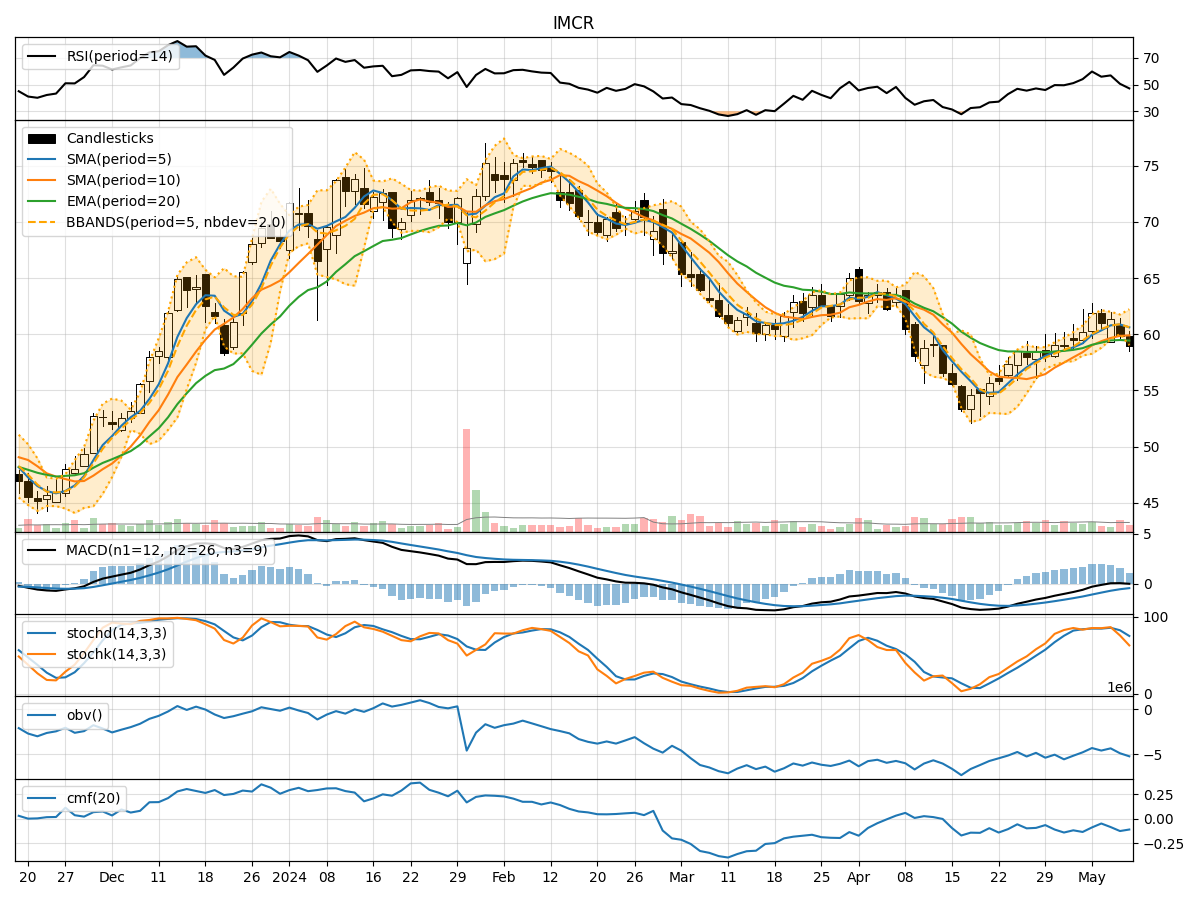
In analyzing the technical indicators for IMCR over the last 5 days, we will delve into the trend, momentum, volatility, and volume indicators to provide a comprehensive outlook on the possible stock price movement. By examining these key aspects, we aim to offer valuable insights and predictions for the upcoming days.
Trend Analysis:
- Moving Averages (MA): The 5-day Moving Average (MA) has been consistently above the Simple Moving Average (SMA) and Exponential Moving Average (EMA), indicating a bullish trend.
- MACD: The MACD line has been below the signal line, suggesting a bearish trend. However, the MACD Histogram has shown signs of convergence, hinting at a potential trend reversal.
Momentum Analysis:
- RSI: The Relative Strength Index (RSI) has been fluctuating but generally staying above 50, indicating a neutral to slightly bullish momentum.
- Stochastic Oscillator: The Stochastic indicators have been gradually decreasing, reflecting a bearish momentum in the short term.
Volatility Analysis:
- Bollinger Bands (BB): The Bollinger Bands have been narrowing, suggesting decreasing volatility in the stock price.
- Bollinger Band Percentage (BBP): The BBP has been hovering around 0.5, indicating a neutral volatility level.
Volume Analysis:
- On-Balance Volume (OBV): The OBV has been consistently negative, signaling a bearish volume flow.
- Chaikin Money Flow (CMF): The CMF has been negative, indicating a bearish pressure on the stock.
Key Observations:
- The trend indicators show a mixed signal with a bullish MA but a bearish MACD.
- Momentum indicators suggest a neutral to slightly bearish sentiment.
- Volatility is decreasing, indicating a potential consolidation phase.
- Volume indicators point towards bearish volume flow.
Conclusion:
Based on the analysis of the technical indicators, the stock price of IMCR is likely to experience further downward movement in the next few days. The bearish momentum, negative volume flow, and mixed trend signals indicate a potential continuation of the current downtrend. Traders and investors should exercise caution and consider short-term selling strategies or wait for a clearer trend reversal signal before considering long positions.