Technical Analysis of IMKTA 2024-05-10
Overview:
In analyzing the technical indicators for IMKTA over the last 5 days, we will delve into the trend, momentum, volatility, and volume indicators to provide a comprehensive outlook on the possible stock price movement. By examining these key aspects, we aim to offer valuable insights and predictions for the upcoming days.
Trend Analysis:
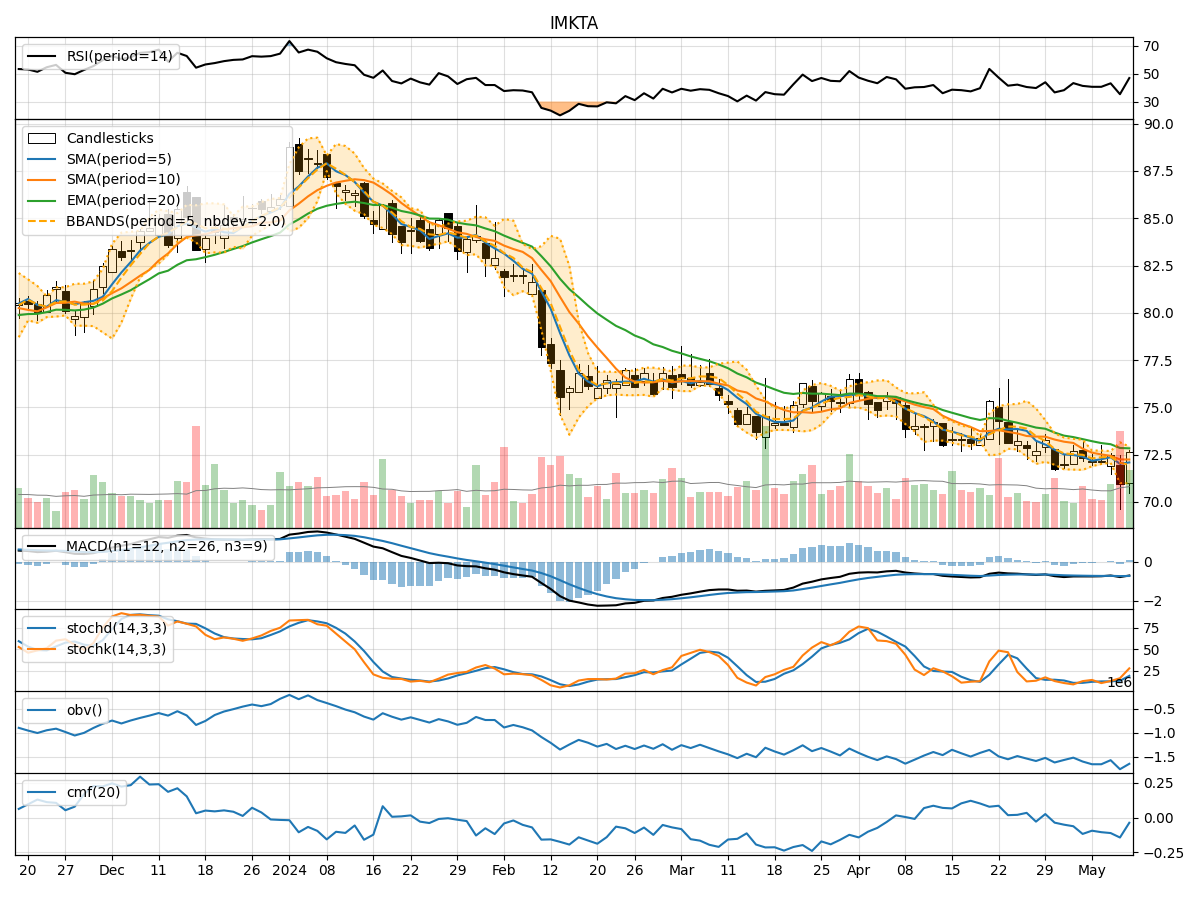
- Moving Averages (MA): The 5-day MA has been fluctuating around the closing prices, indicating a lack of clear trend direction.
- MACD: The MACD line has shown some variability, hovering around the signal line, suggesting indecision in the market.
- EMA: The EMA has been gradually declining, reflecting a bearish sentiment in the short to medium term.
Momentum Analysis:
- RSI: The RSI has been oscillating in the neutral zone, indicating a lack of strong buying or selling pressure.
- Stochastic Oscillator: Both %K and %D have been relatively low, suggesting a potential oversold condition.
- Williams %R: The indicator has been in the oversold territory, signaling a possible reversal in the near future.
Volatility Analysis:
- Bollinger Bands (BB): The bands have widened, indicating increased volatility in the stock price.
- BB %B: The %B indicator has been fluctuating, reflecting the price's relationship to the bands.
- BB Width: The widening of the bands suggests a potential increase in price volatility.
Volume Analysis:
- On-Balance Volume (OBV): The OBV has been declining, indicating selling pressure in the market.
- Chaikin Money Flow (CMF): The CMF has been negative, suggesting outflow of money from the stock.
Key Observations and Opinions:
- Trend: The trend indicators show a lack of clear direction, with a slight bearish bias in the short term.
- Momentum: Momentum indicators suggest a potential oversold condition, hinting at a possible reversal or consolidation.
- Volatility: Increased volatility could lead to sharp price movements in the coming days.
- Volume: The declining OBV and negative CMF indicate bearish sentiment and selling pressure in the market.
Conclusion:
Based on the analysis of the technical indicators, the stock price of IMKTA is likely to experience further downside movement in the near term. The bearish trend, oversold momentum, increased volatility, and negative volume indicators all point towards a potential continuation of the current downward trajectory. Traders and investors should exercise caution and consider short-term selling strategies or wait for a clearer signal before considering long positions.