Technical Analysis of IMNM 2024-05-10
Overview:
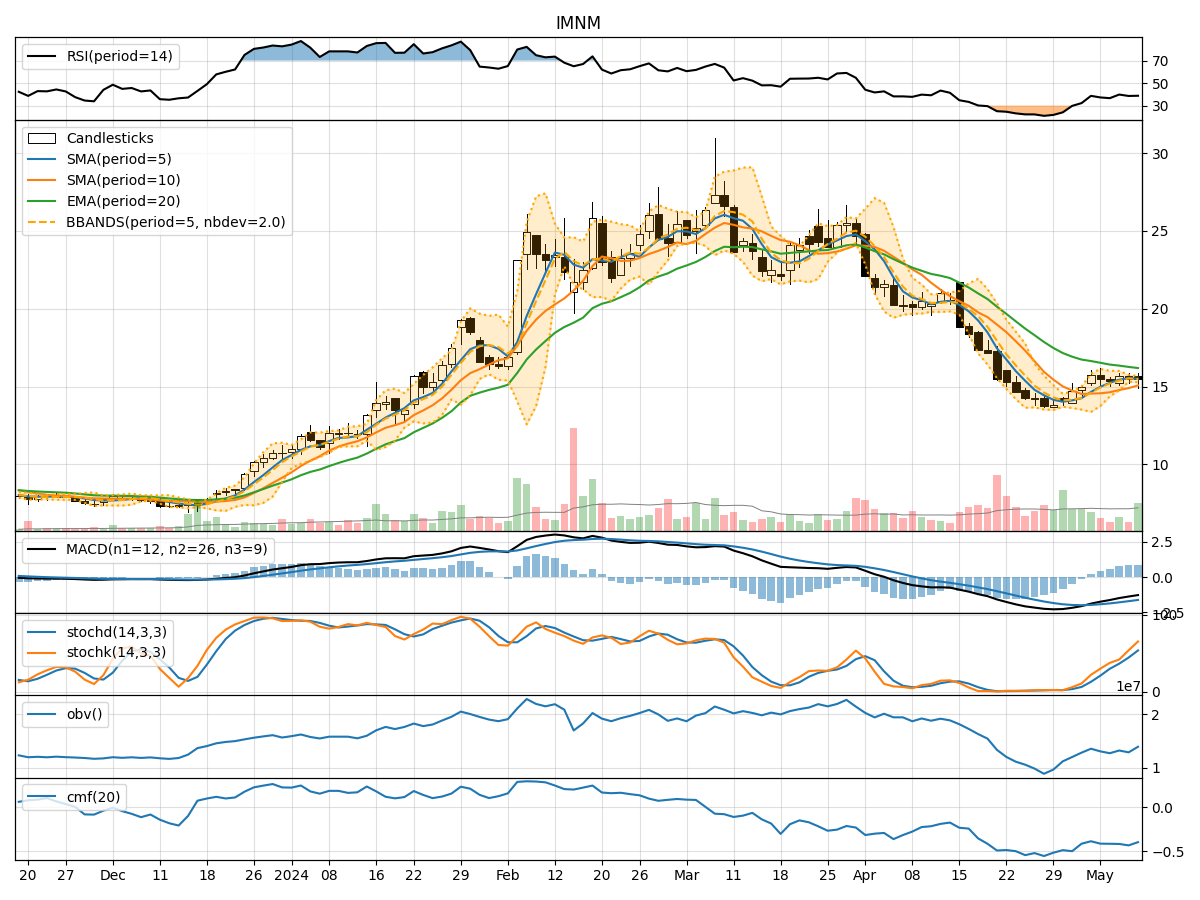
In analyzing the technical indicators for IMNM over the last 5 days, we will delve into the trend, momentum, volatility, and volume indicators to provide a comprehensive outlook on the possible stock price movement. By examining these key factors, we aim to offer valuable insights and predictions for the upcoming days.
Trend Analysis:
- Moving Averages (MA): The 5-day Moving Average (MA) has been consistently above the Simple Moving Average (SMA) and Exponential Moving Average (EMA), indicating a bullish trend.
- MACD: The MACD line has been consistently below the signal line, suggesting a bearish trend.
- MACD Histogram: The MACD Histogram has been gradually increasing, indicating a potential reversal in the bearish trend.
Momentum Analysis:
- RSI: The Relative Strength Index (RSI) has been fluctuating around the 30-70 range, indicating a neutral momentum.
- Stochastic Oscillator: Both %K and %D have been rising, suggesting increasing buying pressure.
- Williams %R: The Williams %R has been hovering around oversold levels, indicating a potential buying opportunity.
Volatility Analysis:
- Bollinger Bands: The stock price has been trading within the Bollinger Bands, suggesting a period of consolidation.
- Bollinger %B: The %B indicator has been fluctuating around the midline, indicating a balanced volatility.
Volume Analysis:
- On-Balance Volume (OBV): The OBV has been fluctuating, indicating indecision among investors.
- Chaikin Money Flow (CMF): The CMF has been negative, suggesting selling pressure in the market.
Key Observations:
- The trend indicators suggest a mixed outlook with bullish moving averages but a bearish MACD.
- Momentum indicators show a neutral stance with potential buying opportunities indicated by the Stochastic Oscillator.
- Volatility remains relatively stable with the stock price trading within the Bollinger Bands.
- Volume indicators reflect indecision among investors with a negative CMF.
Conclusion:
Based on the analysis of the technical indicators, the stock price of IMNM is likely to experience sideways movement in the next few days. The conflicting signals from trend and momentum indicators, coupled with stable volatility and indecisive volume, point towards a period of consolidation. Investors should exercise caution and closely monitor key levels for potential breakout opportunities.