Technical Analysis of IMOS 2024-05-10
Overview:
In analyzing the technical indicators for IMOS over the last 5 days, we will delve into the trend, momentum, volatility, and volume indicators to provide a comprehensive outlook on the possible stock price movement. By examining these key aspects, we aim to offer valuable insights and predictions for the upcoming days.
Trend Analysis:
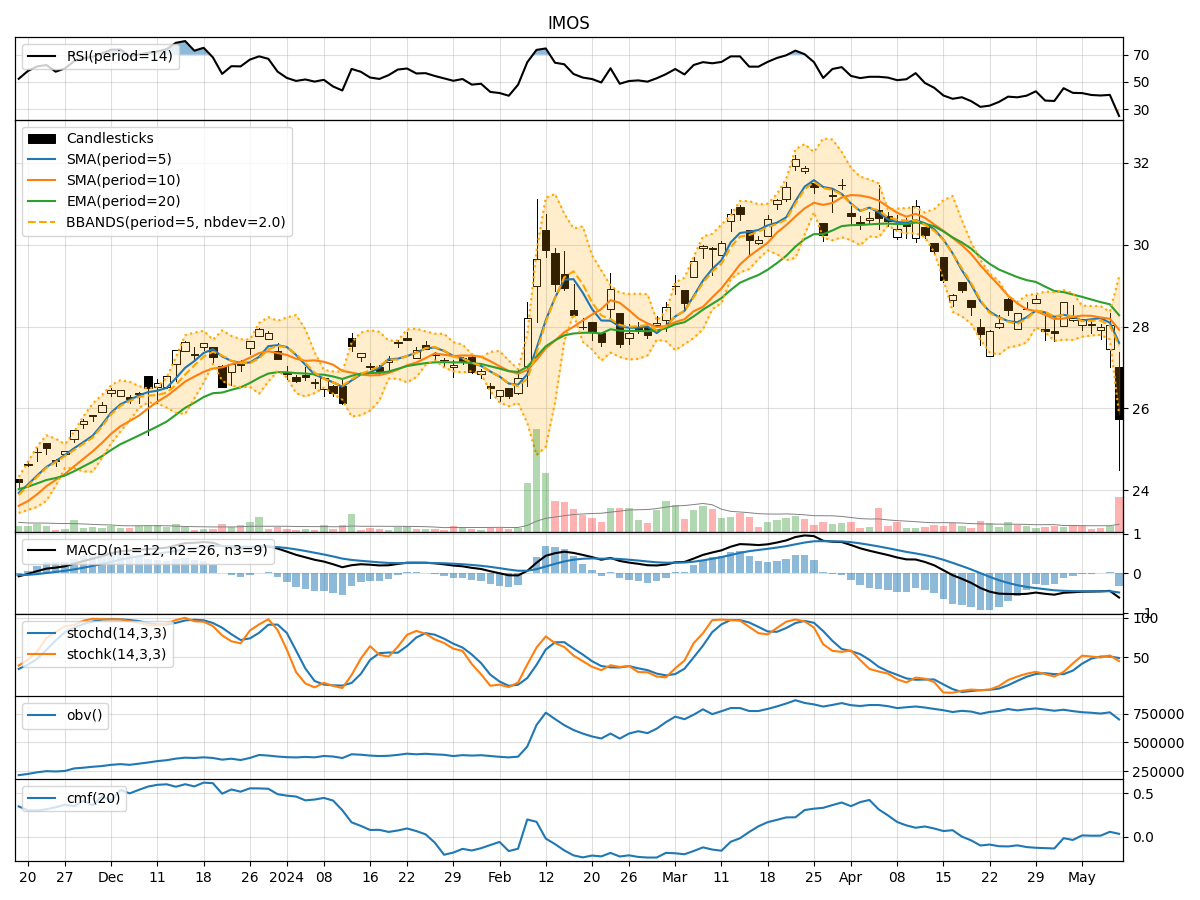
- Moving Averages (MA): The 5-day MA has been declining, indicating a short-term bearish trend.
- MACD: The MACD line has been consistently below the signal line, suggesting bearish momentum.
- EMA: The EMA has been trending downwards, reflecting a weakening trend.
Key Observation: The trend indicators point towards a bearish sentiment in the short term.
Momentum Analysis:
- RSI: The RSI has been fluctuating around the mid-level, indicating indecision in momentum.
- Stochastic Oscillator: Both %K and %D have been oscillating, showing mixed momentum signals.
- Williams %R: The indicator has been in oversold territory, signaling potential buying opportunities.
Key Observation: Momentum indicators suggest a neutral to slightly bearish momentum outlook.
Volatility Analysis:
- Bollinger Bands (BB): The stock price has breached the lower Bollinger Band, indicating potential oversold conditions.
- Bollinger Band Width: The band width has widened, suggesting increased volatility.
- Bollinger Band %B: The %B is close to 0, indicating potential undervaluation.
Key Observation: Volatility indicators imply a potential reversal or consolidation in the stock price.
Volume Analysis:
- On-Balance Volume (OBV): The OBV has been fluctuating, reflecting mixed buying and selling pressure.
- Chaikin Money Flow (CMF): The CMF has shown slight positive accumulation over the past 20 days.
Key Observation: Volume indicators indicate mixed sentiment in terms of buying and selling pressure.
Conclusion:
Based on the analysis of trend, momentum, volatility, and volume indicators, the overall outlook for IMOS in the next few days leans towards a sideways movement with a potential for a bullish reversal. The bearish trend indicated by moving averages and MACD may see a reversal due to oversold conditions highlighted by the Williams %R and Bollinger Bands. The mixed momentum and volume signals suggest a period of consolidation before a potential uptrend.
Key Conclusion: Expect a sideways movement with a bullish bias in the upcoming days for IMOS.