Technical Analysis of IMRN 2024-05-10
Overview:
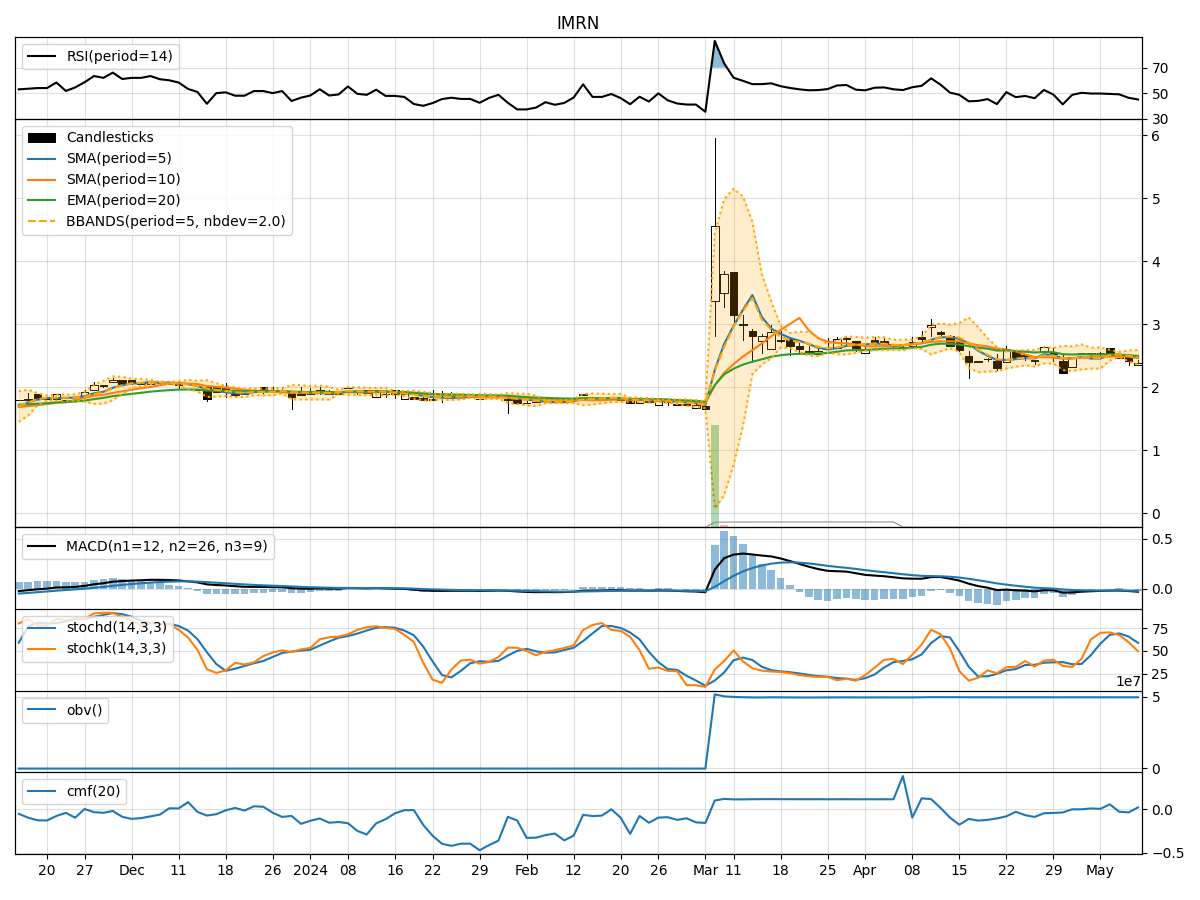
In analyzing the technical indicators for IMRN over the last 5 days, we will delve into the trend, momentum, volatility, and volume indicators to provide a comprehensive outlook on the possible stock price movement in the coming days. By examining these key aspects, we aim to offer valuable insights and predictions for potential investors.
Trend Analysis:
- Moving Averages (MA): The 5-day Moving Average (MA) has been declining steadily, indicating a bearish trend in the short term.
- MACD: The Moving Average Convergence Divergence (MACD) has been consistently negative, suggesting downward momentum.
- EMA: The Exponential Moving Average (EMA) has also been decreasing, aligning with the bearish trend.
Momentum Analysis:
- RSI: The Relative Strength Index (RSI) has been declining, indicating weakening momentum.
- Stochastic Oscillator: Both %K and %D have been decreasing, signaling a bearish momentum.
- Williams %R: The Williams %R is in oversold territory, suggesting a potential reversal or continuation of the downtrend.
Volatility Analysis:
- Bollinger Bands (BB): The Bollinger Bands have been narrowing, indicating decreasing volatility.
- BB%: The %B indicator has been decreasing, reflecting lower volatility levels.
Volume Analysis:
- On-Balance Volume (OBV): The OBV has been declining, suggesting selling pressure in the stock.
- Chaikin Money Flow (CMF): The CMF has been negative, indicating outflow of money from the stock.
Key Observations:
- The stock is currently in a downtrend based on moving averages and MACD.
- Momentum indicators such as RSI and Stochastic Oscillator support the bearish sentiment.
- Volatility is decreasing, which may lead to a period of consolidation or a potential breakout.
- The declining OBV and negative CMF point towards selling pressure in the stock.
Conclusion:
Based on the analysis of the technical indicators, the next few days for IMRN are likely to see a continuation of the bearish trend. Investors should exercise caution as the stock shows signs of weakness in both trend and momentum indicators. The decreasing volatility may lead to a period of consolidation before a potential further downside movement. It is advisable to closely monitor key support levels and wait for a reversal confirmation before considering any long positions.