Technical Analysis of INCR 2024-05-10
Overview:
In analyzing the technical indicators for the stock of INCR over the last 5 days, we will delve into the trend, momentum, volatility, and volume indicators to provide a comprehensive outlook on the possible future stock price movement. By examining these key indicators, we aim to offer valuable insights and recommendations for potential investors.
Trend Analysis:
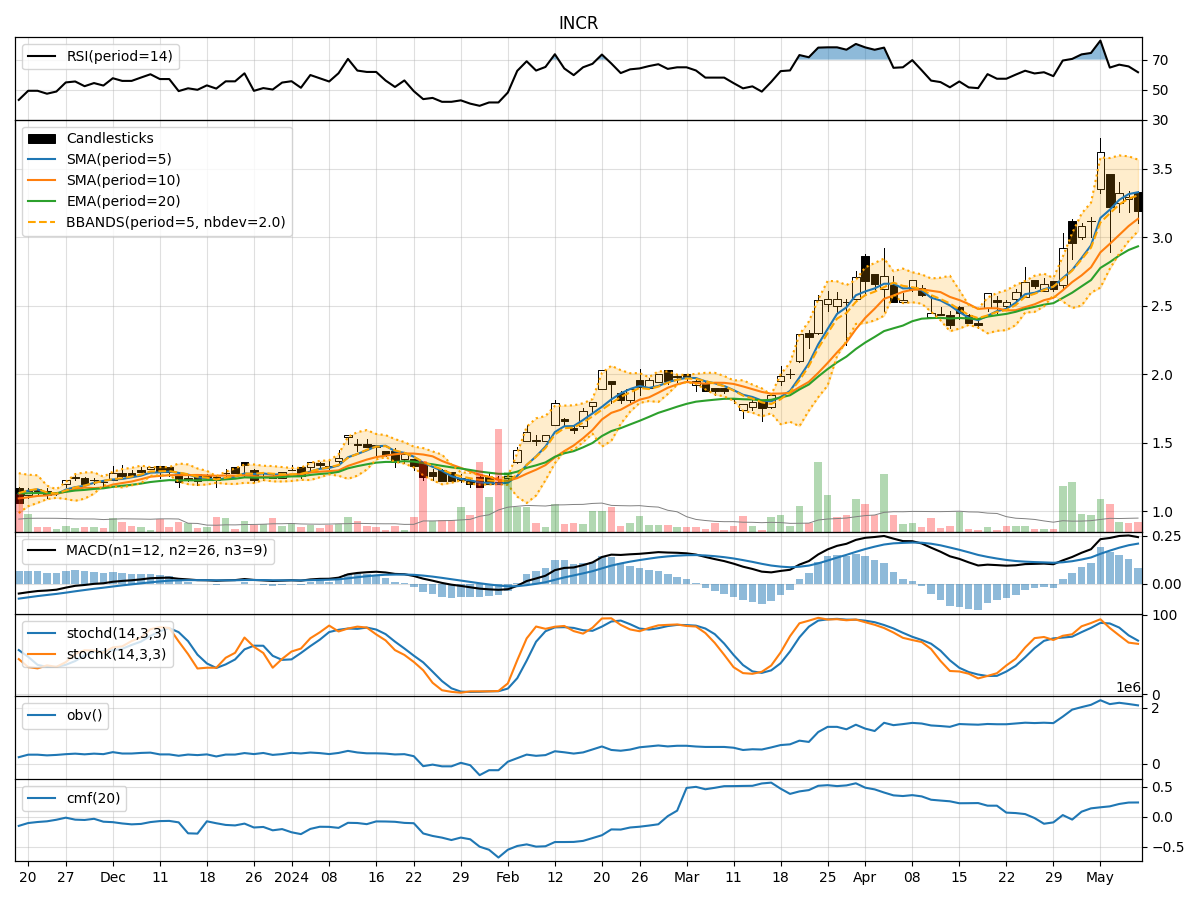
- Moving Averages (MA): The 5-day Moving Average (MA) has been consistently above the Simple Moving Average (SMA) and Exponential Moving Average (EMA), indicating a bullish trend.
- MACD: The MACD line has been above the signal line, with both lines showing an upward trend, suggesting positive momentum in the stock price.
Momentum Analysis:
- RSI: The Relative Strength Index (RSI) has been fluctuating but generally staying above 50, indicating bullish momentum.
- Stochastic Oscillator: Both %K and %D have been declining but are still in the overbought territory, suggesting a potential reversal in the short term.
Volatility Analysis:
- Bollinger Bands (BB): The stock price has been trading within the upper and lower Bollinger Bands, indicating moderate volatility.
Volume Analysis:
- On-Balance Volume (OBV): The OBV has been fluctuating but generally showing an uptrend, suggesting accumulation by investors.
- Chaikin Money Flow (CMF): The CMF has been positive, indicating buying pressure in the stock.
Key Observations:
- The stock is currently in an upward trend based on moving averages and MACD.
- Momentum indicators suggest a mixed sentiment with RSI indicating bullish momentum and Stochastic Oscillator hinting at a potential reversal.
- Volatility is moderate, as indicated by Bollinger Bands.
- Volume indicators show positive accumulation and buying pressure in the stock.
Conclusion:
Based on the analysis of technical indicators, the next few days' possible stock price movement for INCR is likely to be upward with a potential short-term correction due to overbought conditions indicated by the Stochastic Oscillator. Investors may consider buying on dips to capitalize on the overall bullish trend. It is essential to monitor the momentum indicators closely for any signs of a trend reversal.