Technical Analysis of INMD 2024-05-10
Overview:
In analyzing the technical indicators for INMD over the last 5 days, we will delve into the trend, momentum, volatility, and volume indicators to provide a comprehensive outlook on the possible stock price movement in the coming days. By examining these key aspects, we aim to offer valuable insights and predictions to guide investment decisions.
Trend Analysis:
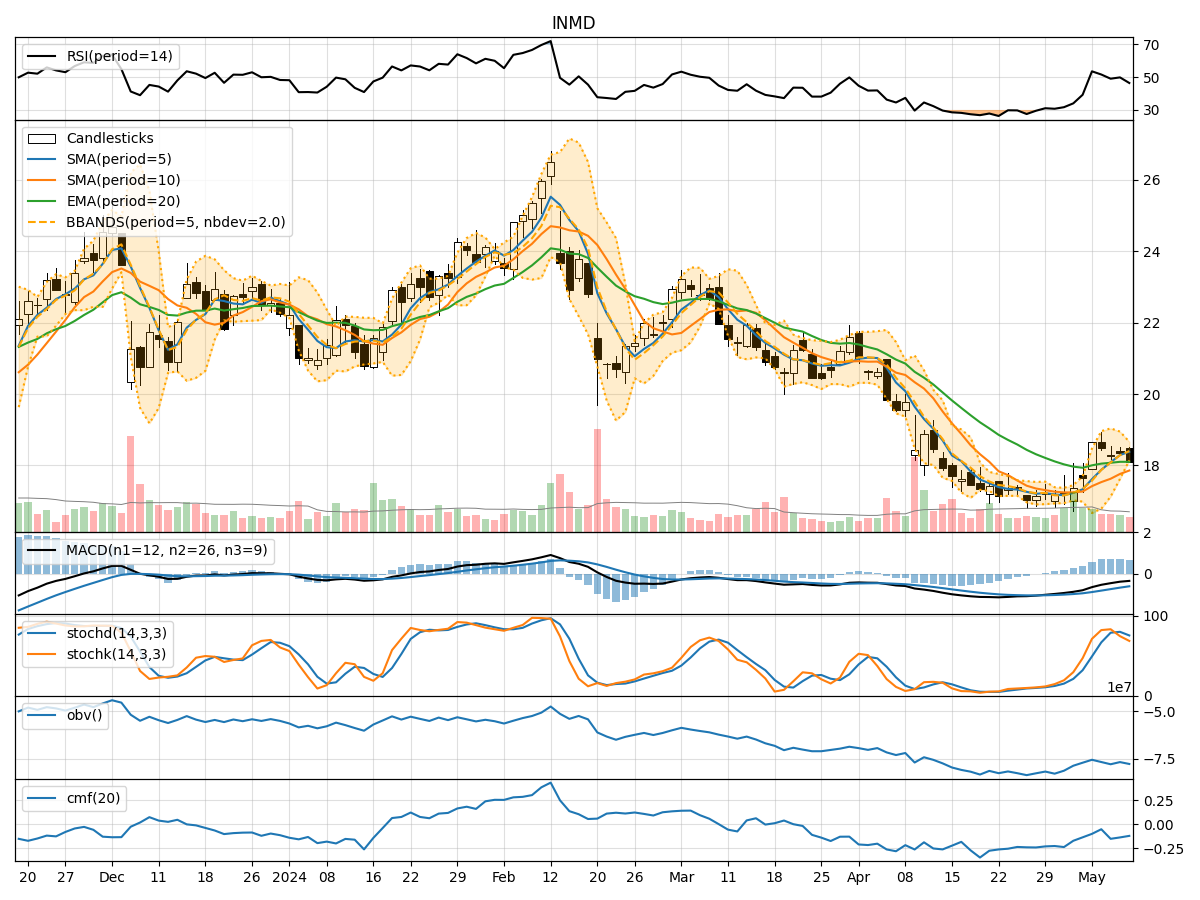
- Moving Averages (MA): The 5-day Moving Average (MA) has been consistently above the Simple Moving Average (SMA) and Exponential Moving Average (EMA), indicating a bullish trend.
- MACD: The MACD line has been below the signal line, suggesting a bearish trend in the short term.
- MACD Histogram: The MACD Histogram has been decreasing, indicating a weakening bearish momentum.
Momentum Analysis:
- RSI: The Relative Strength Index (RSI) has been fluctuating around the 50 level, indicating a lack of strong momentum in either direction.
- Stochastic Oscillator: Both %K and %D have been hovering around the overbought territory, suggesting a potential reversal or consolidation.
- Williams %R: The Williams %R has been in the oversold region, indicating a possible bullish reversal.
Volatility Analysis:
- Bollinger Bands (BB): The stock price has been trading within the Bollinger Bands, with the bands narrowing, indicating decreasing volatility.
- Bollinger %B: The %B indicator has been relatively stable, suggesting a lack of extreme price movements.
Volume Analysis:
- On-Balance Volume (OBV): The OBV has been fluctuating, indicating indecision among investors regarding the stock.
- Chaikin Money Flow (CMF): The CMF has been negative, reflecting selling pressure in the stock.
Key Observations:
- The trend indicators suggest a mixed outlook, with the moving averages indicating a bullish trend while the MACD signals a bearish sentiment.
- Momentum indicators show a lack of clear direction, with RSI hovering around the neutral zone and stochastic oscillators indicating potential reversals.
- Volatility indicators point towards decreasing volatility, which may lead to a period of consolidation.
- Volume indicators reflect uncertainty among investors, with selling pressure evident in the CMF.
Conclusion:
Based on the analysis of the technical indicators, the stock price of INMD is likely to experience sideways movement in the coming days. The conflicting signals from trend and momentum indicators, coupled with decreasing volatility and uncertain volume patterns, suggest a period of consolidation. Investors should exercise caution and closely monitor key support and resistance levels for potential breakout opportunities.