Technical Analysis of INSE 2024-05-10
Overview:
In analyzing the technical indicators for INSE over the last 5 days, we will delve into the trend, momentum, volatility, and volume indicators to provide a comprehensive outlook on the possible stock price movement in the coming days.
Trend Analysis:
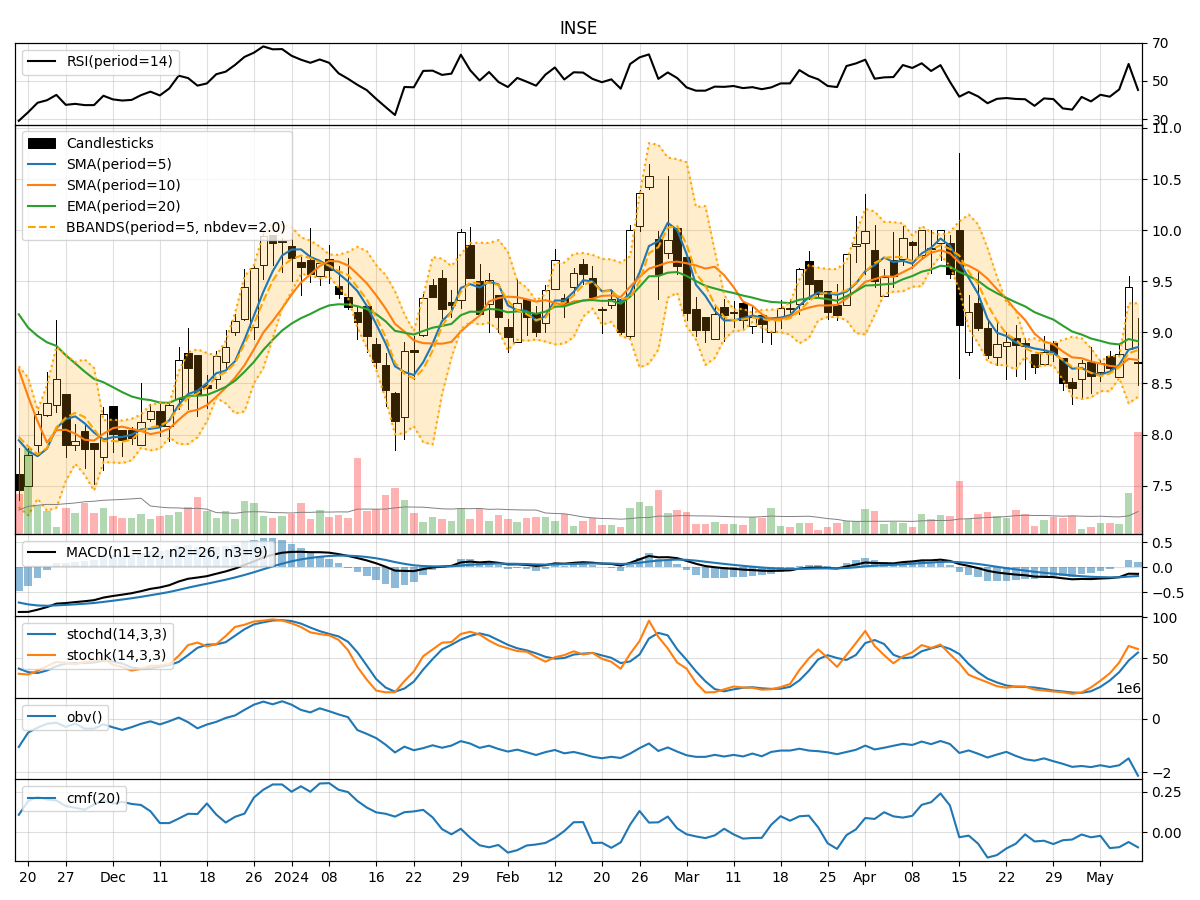
- Moving Averages (MA): The 5-day Moving Average (MA) has been fluctuating around the closing prices, indicating short-term price trends. The Simple Moving Average (SMA) and Exponential Moving Average (EMA) show a slight downward trend, with the EMA lagging behind.
- MACD: The Moving Average Convergence Divergence (MACD) has been negative, indicating a bearish trend. However, the MACD Histogram (MACDH) has shown some signs of improvement in the last two days.
Momentum Analysis:
- RSI: The Relative Strength Index (RSI) has been fluctuating in the neutral zone, suggesting indecision in the market.
- Stochastic Oscillator: Both %K and %D have been in the overbought territory, indicating a potential reversal in the short term.
- Williams %R: The Williams %R is in the oversold region, signaling a possible buying opportunity.
Volatility Analysis:
- Bollinger Bands (BB): The Bollinger Bands have widened, indicating increased volatility. The current price is near the lower band, suggesting a potential bounce back.
- Bollinger %B: The %B is below 1, indicating the stock is trading below the lower band, potentially oversold.
Volume Analysis:
- On-Balance Volume (OBV): The OBV has been fluctuating, indicating mixed buying and selling pressure.
- Chaikin Money Flow (CMF): The CMF has been negative, suggesting outflow of money from the stock.
Key Observations and Opinions:
- Trend: The trend indicators show a mixed picture with a slight bearish bias in the short term.
- Momentum: Momentum indicators suggest a potential reversal in the short term due to overbought and oversold conditions.
- Volatility: Increased volatility could lead to sharp price movements, potentially offering trading opportunities.
- Volume: The volume indicators reflect uncertainty in market participation.
Conclusion:
Based on the analysis of the technical indicators, the stock price of INSE is likely to experience further downside pressure in the short term. The bearish trend indicated by the MACD and the negative CMF signal a lack of buying interest. Traders should exercise caution and consider short-term selling opportunities. The stock is expected to move downward in the next few days.