Technical Analysis of INTU 2024-05-10
Overview:
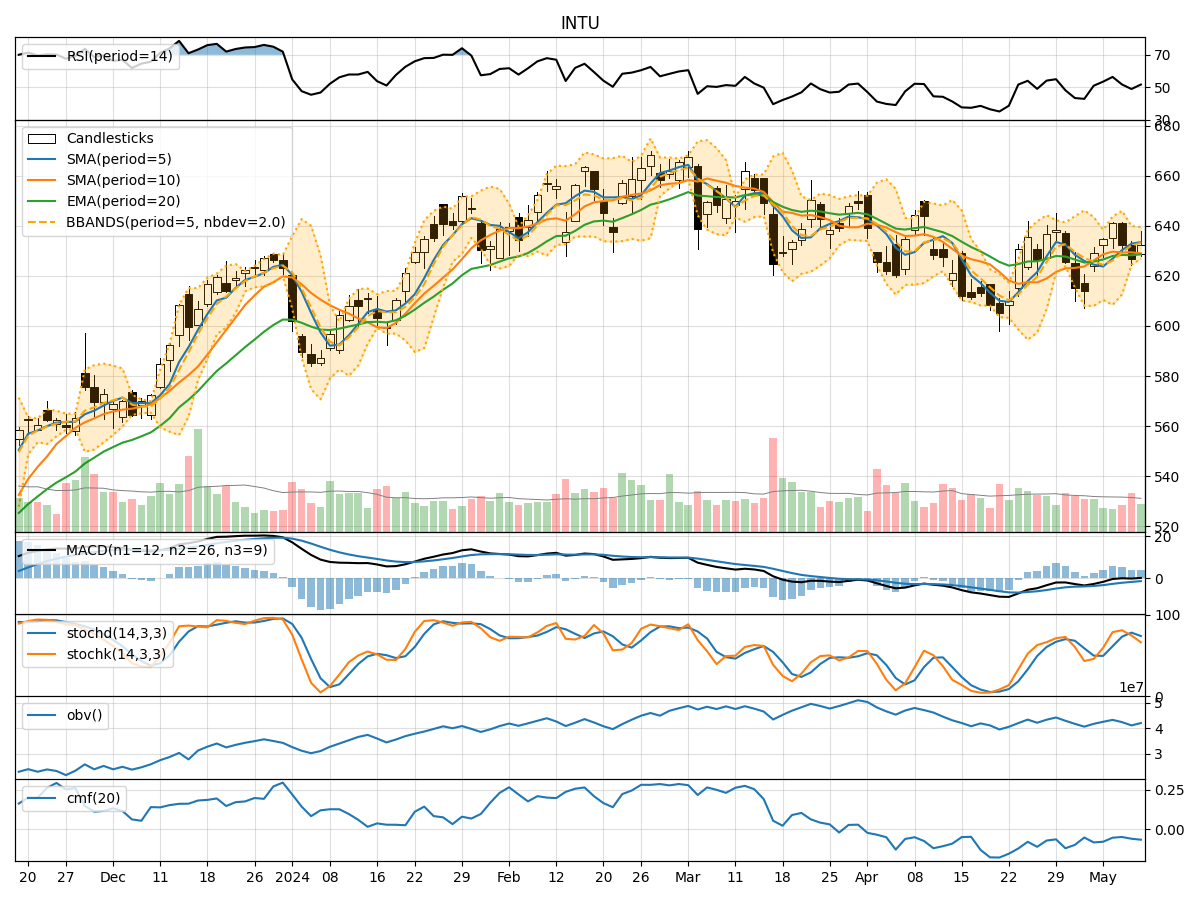
In analyzing the technical indicators for INTU over the last 5 days, we will delve into the trend, momentum, volatility, and volume indicators to provide a comprehensive outlook on the possible stock price movement in the coming days.
Trend Analysis:
- Moving Averages (MA): The 5-day Moving Average (MA) has been consistently above the Simple Moving Average (SMA) and Exponential Moving Average (EMA) over the past 5 days, indicating a bullish trend.
- MACD: The MACD line has been above the signal line, with both lines showing a positive trend, suggesting bullish momentum.
- Conclusion: The trend indicators point towards an upward trend in the stock price.
Momentum Analysis:
- RSI: The Relative Strength Index (RSI) has been fluctuating around the 50 level, indicating a neutral momentum.
- Stochastic Oscillator: Both %K and %D have been fluctuating, showing indecision in momentum.
- Conclusion: The momentum indicators suggest a sideways movement in the stock price.
Volatility Analysis:
- Bollinger Bands (BB): The stock price has been trading within the Bollinger Bands, with the bands narrowing over the last few days, indicating decreasing volatility.
- Conclusion: Volatility indicators signal a consolidation phase in the stock price.
Volume Analysis:
- On-Balance Volume (OBV): The OBV has been fluctuating, indicating mixed buying and selling pressure.
- Chaikin Money Flow (CMF): The CMF has been negative, suggesting a bearish money flow.
- Conclusion: Volume indicators reflect a neutral to bearish sentiment in the stock.
Conclusion:
Based on the analysis of trend, momentum, volatility, and volume indicators, the next few days' possible stock price movement for INTU is likely to be sideways with a slight bearish bias. The trend indicators suggest an upward trend, while momentum indicators indicate a sideways movement. Volatility indicators point towards consolidation, and volume indicators reflect a neutral to bearish sentiment.
Considering the overall analysis, it is recommended to closely monitor the stock price for any potential breakout or reversal signals. Traders may consider implementing risk management strategies to navigate the current market conditions effectively.