Technical Analysis of IONR 2024-05-10
Overview:
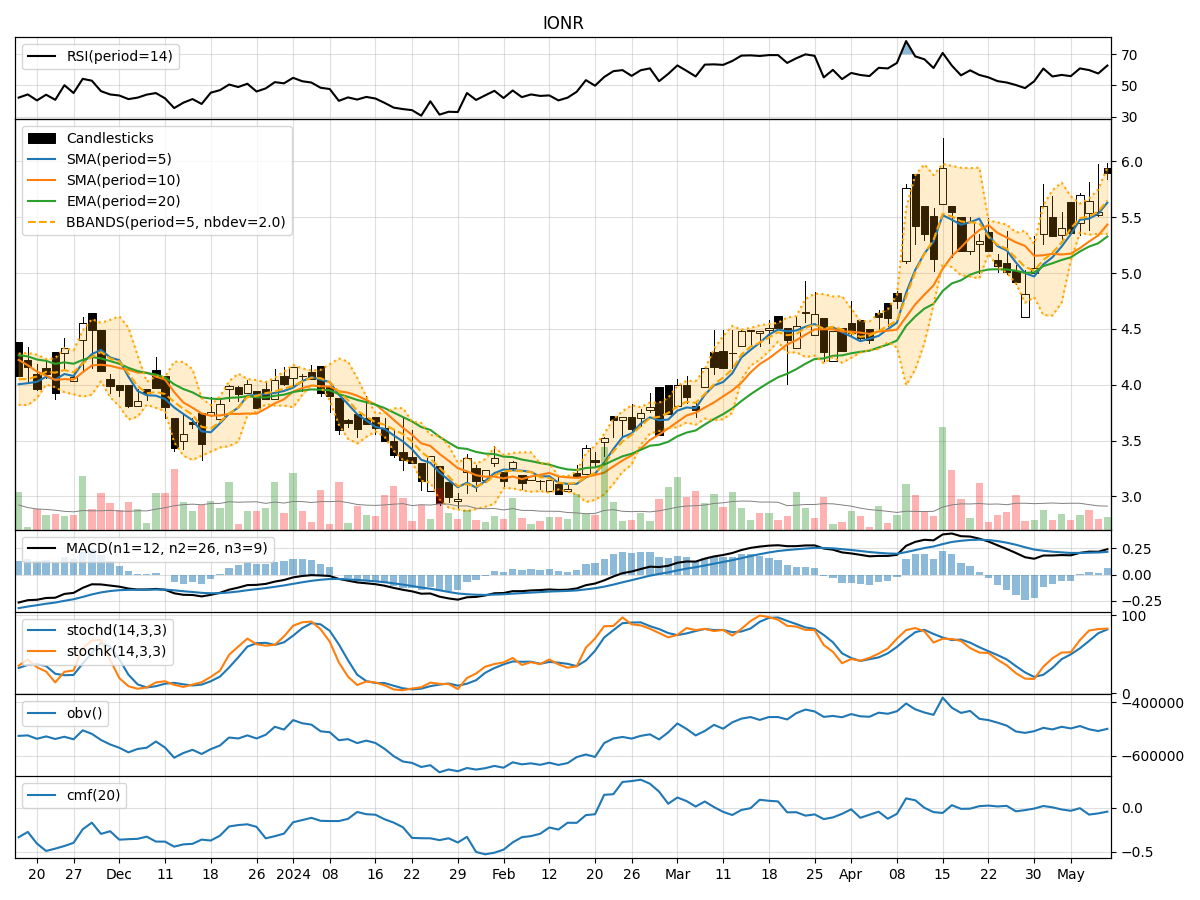
In analyzing the technical indicators for IONR over the last 5 days, we will delve into the trend, momentum, volatility, and volume indicators to provide a comprehensive outlook on the possible stock price movement. By examining these key factors, we aim to offer valuable insights and predictions for the upcoming days.
Trend Indicators:
- Moving Averages (MA): The 5-day MA has been consistently above the closing price, indicating a bullish trend.
- MACD: The MACD line has been above the signal line, suggesting a positive momentum in the stock price.
- EMA: The exponential moving average has been trending upwards, supporting the bullish sentiment.
Momentum Indicators:
- RSI: The Relative Strength Index has been fluctuating around the overbought territory, indicating strong buying momentum.
- Stochastic Oscillator: Both %K and %D have been in the overbought zone, signaling a potential reversal.
- Williams %R: The indicator has been hovering in the oversold region, suggesting a possible buying opportunity.
Volatility Indicators:
- Bollinger Bands: The stock price has been trading within the bands, indicating a period of consolidation.
- Bollinger %B: The %B value has been fluctuating around 0.5, suggesting a balanced market sentiment.
Volume Indicators:
- On-Balance Volume (OBV): The OBV has been fluctuating, indicating indecision among investors.
- Chaikin Money Flow (CMF): The CMF has been negative, reflecting selling pressure in the stock.
Key Observations:
- The trend indicators suggest a bullish sentiment in the stock price.
- Momentum indicators show mixed signals with overbought and oversold conditions.
- Volatility indicators point towards a period of consolidation.
- Volume indicators indicate indecision among investors with selling pressure.
Conclusion:
Based on the analysis of the technical indicators, the stock of IONR is likely to experience sideways movement in the upcoming days. The bullish trend supported by moving averages and MACD may be offset by the overbought conditions in momentum indicators and selling pressure reflected in volume indicators. Investors should closely monitor key levels and wait for clearer signals before making trading decisions.